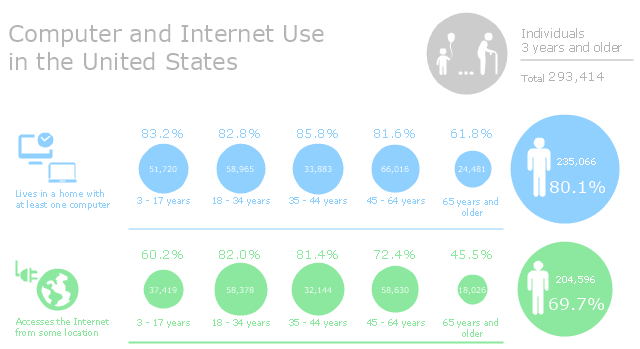
This infographic sample was created on the base of "Computer and Internet Use in the United States. Population Characteristics. Thom File. Issued May 2013." from the website of U.S. Census Bureau (U.S. Department of Commerce. Economics and Statistics Administration). [census.gov/ prod/ 2013pubs/ p20-569.pdf]
The infogram example "Computer and Internet Use in the United States" was created using the ConceptDraw PRO diagramming and vector drawing software extended with the Pictorial Infographic solition from the area "What is infographics" in ConceptDraw Solution Park.
The infogram example "Computer and Internet Use in the United States" was created using the ConceptDraw PRO diagramming and vector drawing software extended with the Pictorial Infographic solition from the area "What is infographics" in ConceptDraw Solution Park.
Pictorial infogram
HelpDesk
How to Draw a Pictorial Chart in ConceptDraw PRO
