This site uses cookies. By continuing to browse the ConceptDraw site you are agreeing to our Use of Site Cookies.

seven management and planning tools Seven Management and Planning Tools

seven management and planning tools
Seven Management and Planning Tools solution extends ConceptDraw DIAGRAM and ConceptDraw MINDMAP with features, templates, samples and libraries of vector stencils for drawing management mind maps and diagrams.

The Action Plan

Action Plan - For the action planning define people and groups involvement in corrective actions by roles, identify logical sequences of scheduled actions and critical path of problem solving, identify possible risks of action plan and propose preventive actions.
ConceptDraw Office suite is a software for decision making and action plan.
7MP Tools
7MP Tools

Flowchart Definition

Flowchart definition - A Flowchart is a graphically representation of the structure of process or system, algorithm or the step-by-step solution of the problem. The Flowchart describes the flow of data through an information processing systems and the parts of the flows. The flow is a set of the logic operations that meet the certain requirements.

Cause and Effect Analysis

Cause and Effect Analysis - The Seven Management and Planning Tools is a tool for Cause and Effect Analysis that allows users to analyze the root causes for factors that influenced the problem. This diagram is constructed separately for each highly prioritized factor. The Diagram is then used for further formulation of potential actions.
7MP Tools
7MP Tools

Problem solving

Problem Solving - ConceptDraw OFFICT suite is a software for the problem solving. The Seven Management and Planning Tools solution is a set of such tools for investigating complex problems.
These tools are exemplary at organizing research, parsing complex problems, providing a structure for the details, helping managers make decisions, and organizing effective communications in a visual manner that keeps everyone involved.

Using Fishbone Diagrams for Problem Solving

Problems are obstacles and challenges that one should overcome to reach the goal. They are an inseparable part of any business, and the success of an enterprise often depends on ability to solve all problems effectively. The process of problem solving often uses rational approach, helping to find a suitable solution.
Using Fishbone Diagrams for Problem Solving is a productive and illustrative tool to identify the most important factors causing the trouble. ConceptDraw DIAGRAM extended with Fishbone Diagrams solution from the Management area of ConceptDraw Solution Park is a powerful tool for problem solving with Fishbone Ishikawa diagram graphic method.

Marketing Analysis Diagram
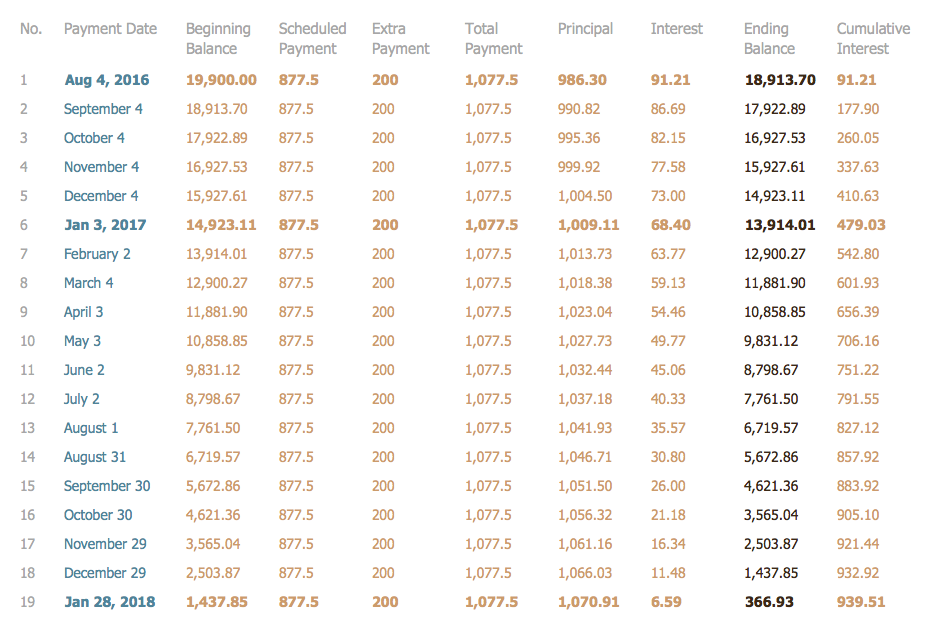
An example of marketing analysis diagram, can be used to analyse product market and define marketing strategy.

Tables’ Beauty

To keep data in tables is useful, but tables are not convenient for presentations or communication. All graphs are intended to make the presentation of data clearly and simply. But are tables always that bad?

Functional Flow Block Diagram

You need to draw a Functional Flow Block Diagram? You are an artist? Now it doesn't matter. With Block Diagrams solution from the "Diagrams" area for ConceptDraw Solution Park you don't need more to be an artist to design the Functional Flow Block Diagram of any complexity.

PDPC

ConceptDraw DIAGRAM extended with Seven Management and Planning Tools Solution from the Management Area of ConceptDraw Solution Park is the best software for drawing all types of diagrams from the Seven Management and Planning Tools: Affinity Diagram, Relations Diagram, Prioritization Matrix, Root Cause Analysis Tree Diagram, Involvement Matrix, PERT Chart, and Risk Diagram (PDPC).