Data Flow Diagram

ORM Diagram

Functional Flow Block Diagram

Workflow Diagram Software Mac

Entity Relationship Diagram Examples


ERD Symbols and Meanings

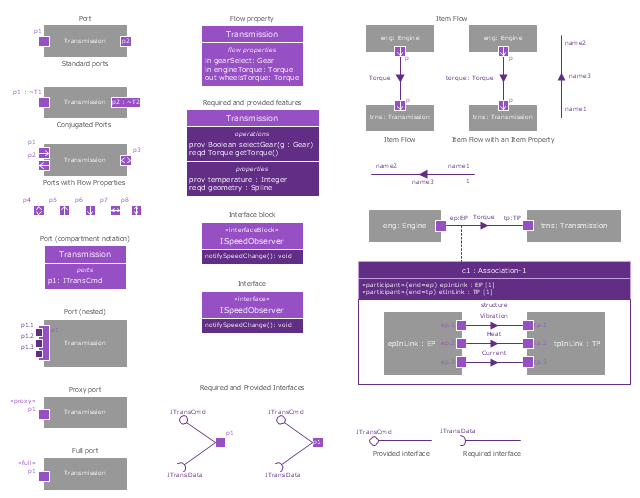
The vector stencils library "Ports and Flows" contains 26 SysML symbols.
Use it to design your SysML diagrams using ConceptDraw PRO diagramming and vector drawing software.
"The main motivation for specifying ports and flows is to enable design of modular, reusable blocks with clearly defined
ways of connecting and interacting with their context of use. This clause extends UML ports to support nested ports, and
extends blocks to support flow properties, and required and provided features, including blocks that type ports. Ports can be typed by blocks that support operations, receptions, and properties as in UML. SysML defines a specialized form of Block (InterfaceBlock) that can be used to support nested ports. SysML identifies two kinds of ports, one that exposes
features of the owning block or its internal parts (proxy ports), and another that supports its own features (full ports). Default compatibility rules are defined for connecting blocks used in composite structure, including parts and ports, with association blocks available to define more specific ways of doing this. These additional capabilities in SysML enable modelers to specify a wide variety of interconnectable components, which can be implemented through many engineering and social techniques, such as software, electrical or mechanical components, and human organizations. This clause also extends UML information flows for specifying item flows across connectors and associations." [www.omg.org/ spec/ SysML/ 1.3/ PDF]
The SysML shapes example "Design elements - Ports and Flows" is included in the SysML solution from the Software Development area of ConceptDraw Solution Park.
SysML ports and flows symbols
- Parts Of Context Diagram Pdf
- Context Diagram Of Human Resource Management System
- Dfd Diagram Tools On Mac
- How to Create an IDEF0 Diagram for an Application Development ...
- Hotel reservation system | Manual Booking System
- Diagramming Software for Design UML Activity Diagrams | UML ...
- About UML | UML state machine diagram - State transitions of RT ...
- Design elements - Ports and Flows | Design elements - UML ...
- Design elements - Ports and Flows | Best Tool for Infographic ...
- Design elements - HVAC ductwork | Process Flowchart | Electrical ...