Total Quality Management Definition

 Pie Charts
Pie Charts are extensively used in statistics and business for explaining data and work results, in mass media for comparison (i.e. to visualize the percentage for the parts of one total), and in many other fields. The Pie Charts solution for ConceptDraw DIAGRAM offers powerful drawing tools, varied templates, samples, and a library of vector stencils for simple construction and design of Pie Charts, Donut Chart, and Pie Graph Worksheets.
Scatter Graph

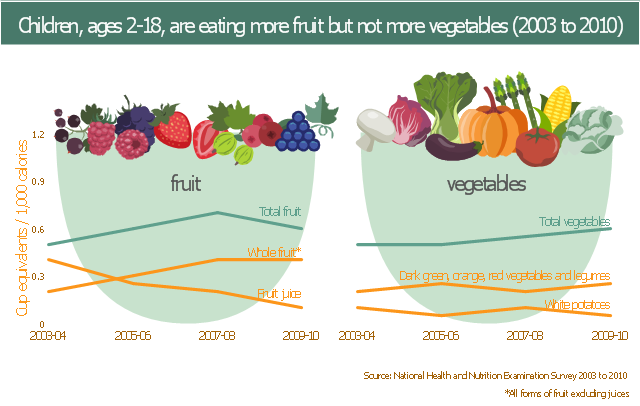
This human nutrition infogram example was redesigned from the figure from the web page "Progress on Children Eating More Fruit, Not Vegetables" from the U.S. Centers for Disease Control and Prevention (CDC) website.
[cdc.gov/ vitalsigns/ fruit-vegetables/ ]
"Fruits are generally high in fiber, water, vitamin C and sugars, although this latter varies widely from traces as in lime, to 61% of the fresh weight of the date. Fruits also contain various phytochemicals that do not yet have an RDA/ RDI listing under most nutritional factsheets, and which research indicates are required for proper long-term cellular health and disease prevention. Regular consumption of fruit is associated with reduced risks of cancer, cardiovascular disease (especially coronary heart disease), stroke, Alzheimer disease, cataracts, and some of the functional declines associated with aging.
Diets that include a sufficient amount of potassium from fruits and vegetables also help reduce the chance of developing kidney stones and may help reduce the effects of bone-loss. Fruits are also low in calories which would help lower one's calorie intake as part of a weight-loss diet." [en.wikipedia.org/ wiki/ Fruit]
"Vegetables play an important role in human nutrition. Most are low in fat and calories but are bulky and filling. They supply dietary fibre and are important sources of essential vitamins, minerals and trace elements. Particularly important are the antioxidant vitamins A, C and E. When vegetables are included in the diet, there is found to be a reduction in the incidence of cancer, stroke, cardiovascular disease and other chronic ailments. Research has shown that, compared with individuals who eat less than three servings of fruits and vegetables each day, those that eat more than five servings have an approximately twenty percent lower risk of developing coronary heart disease or stroke." [en.wikipedia.org/ wiki/ Vegetable]
The example "Fruit and vegetables consumption infogram" was designed using the ConceptDraw PRO diagramming and vector drawing software extended with the Food Court solution from the Food and Beverages area of ConceptDraw Solution Park.
Human nutrition infogram
Flowchart Marketing Process. Flowchart Examples

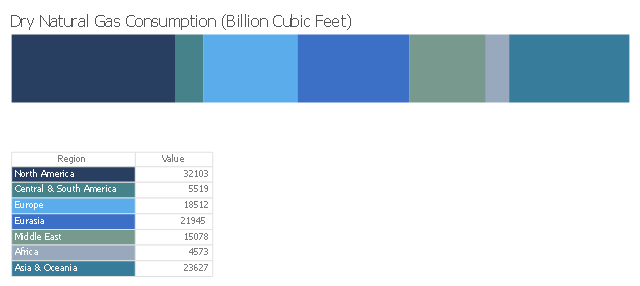
This divided bar diagram sample shows the global natural gas consumption by regions in 2013. It was designed using data of the International Energy Statistics webpage from the U.S. Energy Information Administration (EIA) website. [eia.gov/ cfapps/ ipdbproject/ IEDIndex3.cfm?tid=3&pid=26&aid=2]
"Natural gas is a fossil fuel formed when layers of buried plants and animals are exposed to intense heat and pressure over thousands of years. The energy that the plants originally obtained from the sun is stored in the form of chemical bonds in natural gas. Natural gas is a nonrenewable resource because it cannot be replenished on a human time frame. Natural gas is a hydrocarbon gas mixture consisting primarily of methane, but commonly includes varying amounts of other higher alkanes and even a lesser percentage of carbon dioxide, nitrogen, and hydrogen sulfide. Natural gas is an energy source often used for heating, cooking, and electricity generation. It is also used as fuel for vehicles and as a chemical feedstock in the manufacture of plastics and other commercially important organic chemicals." [Natural gas. Wikipedia]
The chart example "Global natural gas consumption" was created using ConceptDraw PRO diagramming and vector drawing software extended with the Divided Bar Diagrams solution from the Graphs and Charts area of ConceptDraw Solution Park.
Divided bar chart
Flow chart Example. Warehouse Flowchart


 Divided Bar Diagrams
The Divided Bar Diagrams Solution extends the capabilities of ConceptDraw DIAGRAM with templates, samples, and a library of vector stencils for drawing high impact and professional Divided Bar Diagrams and Graphs, Bar Diagram Math, and Stacked Graph.
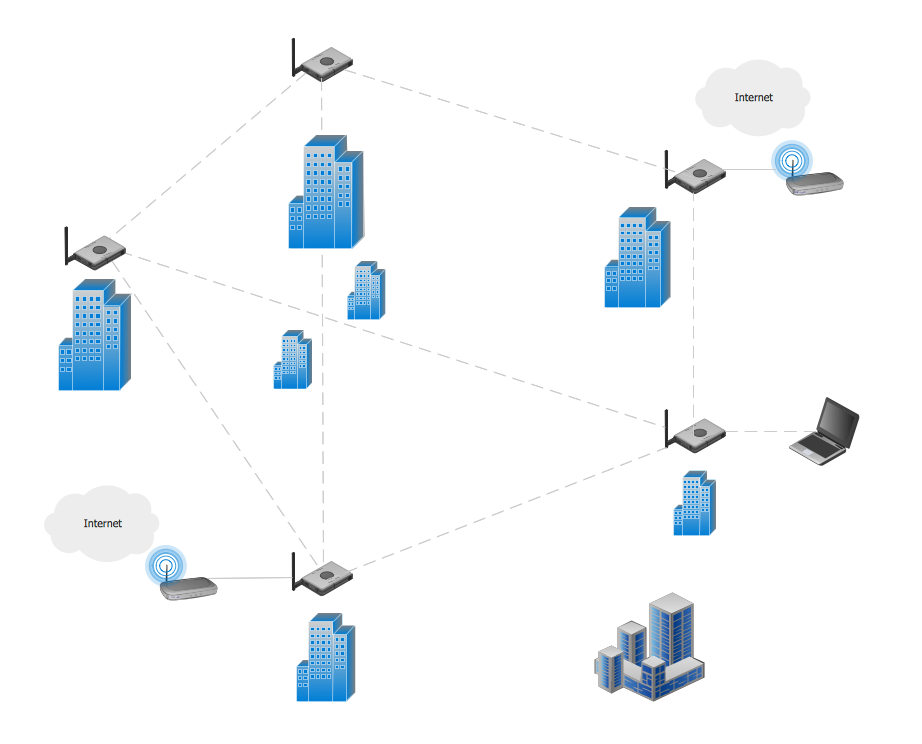
Mesh Network. Computer and Network Examples

"The United States is the 800th largest energy consumer in terms of total use in 2010. ...
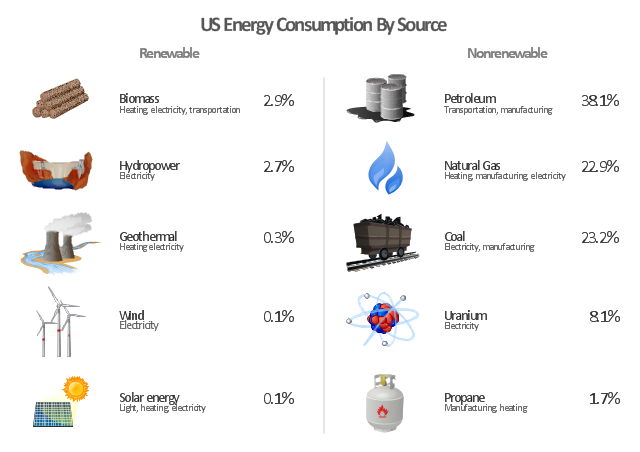
The majority of this energy is derived from fossil fuels: in 2010, data showed 25% of the nation's energy came from petroleum, 22% from coal, and 22% from natural gas. Nuclear power supplied 8.4% and renewable energy supplied 8%, which was mainly from hydroelectric dams although other renewables are included such as wind power, geothermal and solar energy." [Energy in the United States. Wikipedia]
The infographics example "U.S. energy consumption by source" was created in the ConceptDraw PRO diagramming and vector drawing software using the Manufacturing and Maintenance solution from the Illustration area of ConceptDraw Solution Park.
Infographics
- Energy Pyramid Diagram | Chart Examples | U.S. energy ...
- Fruit and vegetables consumption infogram | Pictures of Vegetables ...
- Pie chart - Domestic energy consumption | Target and Circular ...
- U.S. primary energy consumption by source and sector | U.S. energy ...
- Domestic sector SWOT | Pie chart - Domestic energy consumption ...
- Example Of Renewable Energy Sources
- Energy resources diagram | U.S. energy consumption by source ...
- Energy resources diagram | Pie Charts | U.S. energy consumption ...
- U.S. primary energy consumption by source and sector | Pie Charts ...