Process Flowchart
The main reason of using Process Flowchart or PFD is to show relations between major parts of the system. Process Flowcharts are used in process engineering and chemical industry where there is a requirement of depicting relationships between major components only and not include minor parts. Process Flowcharts for single unit or multiple units differ in their structure and implementation. ConceptDraw DIAGRAM is Professional business process mapping software for making Process flowcharts, Process flow diagram, Workflow diagram, flowcharts and technical illustrations for business documents and also comprehensive visio for mac application. Easier define and document basic work and data flows, financial, production and quality management processes to increase efficiency of your business with ConcepDraw DIAGRAM. Business process mapping software with Flowchart Maker ConceptDraw DIAGRAM includes extensive drawing tools, rich examples and templates, process flowchart symbols and shape libraries, smart connectors that allow you create the flowcharts of complex processes, process flow diagrams, procedures and information exchange. Process Flowchart Solution is project management workflow tools which is part ConceptDraw Project marketing project management software. Drawing charts, diagrams, and network layouts has long been the monopoly of Microsoft Visio, making Mac users to struggle when needing such visio alternative like visio for mac, it requires only to view features, make a minor edit to, or print a diagram or chart. Thankfully to MS Visio alternative like ConceptDraw DIAGRAM software, this is cross-platform charting and business process management tool, now visio alternative for making sort of visio diagram is not a problem anymore however many people still name it business process visio tools.
Gant Chart in Project Management
Gantt Chart is a graphical representation of tasks as segments on a time scale. It helps plan and monitor project development or resource allocation. There are list of tasks, project milesones and stages. The horizontal axis is a time scale, expressed either in absolute or relative time. Gantt chart can be used for planning in virtually any industry. There are major project planning tools using gantt chart for creating project plan. For instance, using ConceptDraw PROJECT together with ConceptDraw MINDMAP for planning marketing actions is very effective way. It makes ConceptDraw Office best marketing project management software for gantt chart planning marketing message, scheduling stages when to send massive text messages or when use email marketing services in specific projects. There are simple steps on how to use project management software for marketing, sales actions and product support. This is simple all in one toolbox for managers who need best project management software for small business as for planning and brainstorming as for reporting at project execution stage. Using gantt charts together with mindmap visuals and professional presentations charts make it excellent creative project management software. ConceptDraw PROJECT is portfolio project management software it allows manage many projects with multi gantt chart.
Flowchart design. Flowchart symbols, shapes, stencils and icons
A flowchart is a type of diagram which represents an algorithm, process or workflow, displays the steps as boxes of various kinds and depicts their order by connecting them with arrows. Any business graphic document will be more colorful and understandable if will use professional-looking and visual diagrams and flowcharts. Flowchart design gives versatile presenting and explaining of the process. ConceptDraw DIAGRAM flowchart software enhanced with Flowcharts solution helps effectively make Flowchart Design. Use of predesigned flowchart symbols and bright color palette offers a fresh view and favorably distinguishes the flowcharts designed in ConceptDraw DIAGRAM from the black and white flowcharts on a paper. Preferably to use no more than three or four colors and apply identical for the same shape types. The best flowchart design can be achieved by starting with Flowchart template, or any of suitable ready examples or samples offered in ConceptDraw STORE, open one of them and enter the proper text into each Flowchart shape. Each symbol of the flowchart has a definition that can't be changed. This means that all flowcharts shapes can be grouped in according to their meaning. Users with ConceptDraw DIAGRAM flowchart software can style groups of symbols with close definitions by color sets chosen from complementary palette. Almost all workflows can be depicted as a flowchart. Colored diagrams are more light for perception of the certain information, this is part of flowchart design. Bright colors need to be used in the key points of Decision symbols, to focus attention on their importance for whole process flow.
How to Create Presentation of Your Project Gantt Chart
During the planning, discussing and execution of a project you may need to prepare a presentation using project views such as the Gantt Chart, Multiproject Dashboard or Resource Usage View. It’s easy do with ConceptDraw PROJECT!How To Draw Building Plans
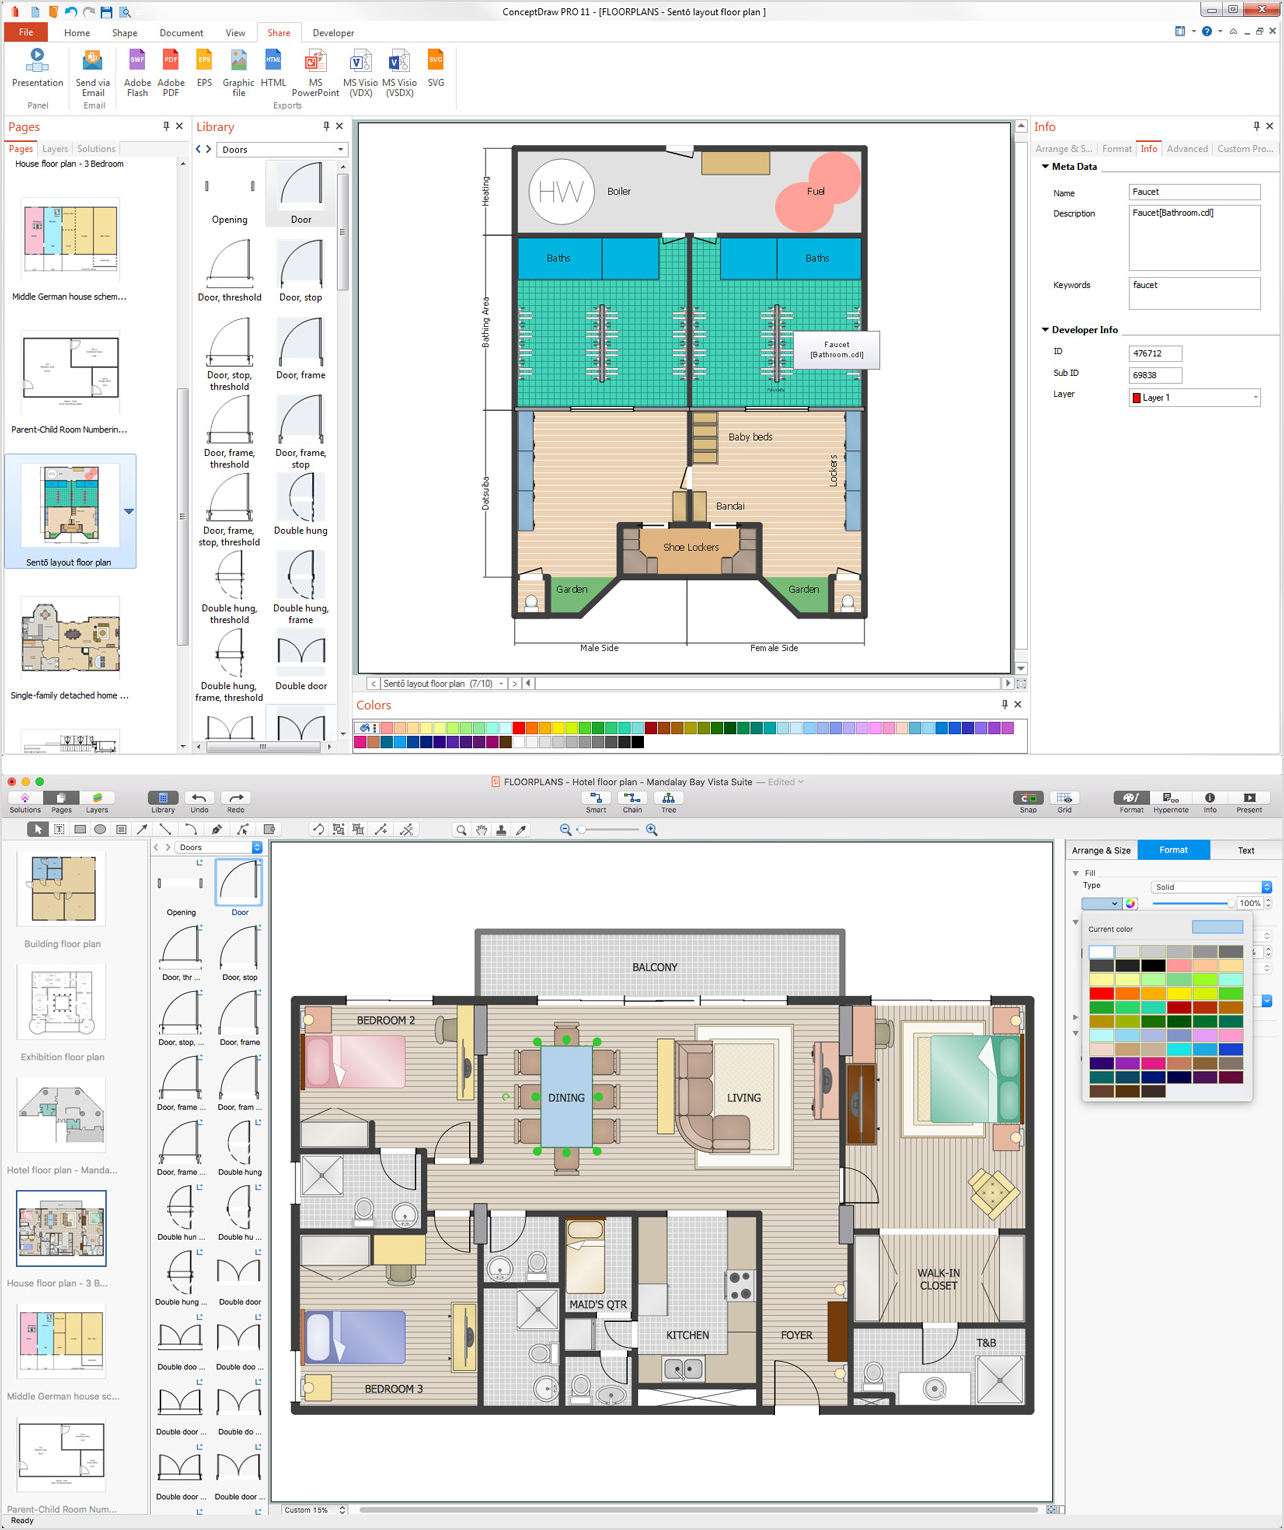
Building Plan is the basis for implementation construction and repair works. Creation of Building Plans is the main purpose of architects and designers. They are required and even obligatory for builders to accurately implement your wishes and ideas during the building, designing or redesigning your home, flat, office, or any other premise. ConceptDraw DIAGRAM is a powerful quick building plan software for creating great-looking Office layouts, Home floor plans, Commercial floor plans, Storage building plans, Expo and Shopping mall building plans, School and Training building plans, Cafe or Restaurant plans, Gym and Spa area plans, Sport field plans, House interior designs, Electric and Telecom building plans, Fire and Emergency plans, HVAC plans, Security and Access plans, Plumbing and Piping plans, Plant layouts, etc. Use helpful samples, templates and variety of libraries with numerous building design elements from Floor Plans solution for ConceptDraw DIAGRAM software to facilitate design drawing process.Project — Working With Costs
ConceptDraw PROJECT delivers a rich set of built-in functionalities and optional product extensions that support your daily workflow in time-saving and creative ways. This video lesson will teach you how to work with costs in your project document.Business diagrams & Org Charts with ConceptDraw DIAGRAM
The business diagrams are in great demand, they describe the business processes, business tasks and activities which are executed to achieve specific organizational and business goals, increase productivity, reduce costs and errors. They let research and better understand the business processes. ConceptDraw DIAGRAM is a powerful professional cross-platform business graphics and business flowcharting tool which contains hundreds of built-in collections of task-specific vector stencils and templates. They will help you to visualize and structure information, create various Business flowcharts, maps and diagrams with minimal efforts, and add them to your documents and presentations to make them successful. Among them are Data flow diagrams, Organization charts, Business process workflow diagrams, Audit flowcharts, Cause and Effect diagrams, IDEF business process diagrams, Cross-functional flowcharts, PERT charts, Timeline diagrams, Calendars, Marketing diagrams, Pyramids, Target diagrams, Venn diagrams, Comparison charts, Analysis charts, Dashboards, and many more. Being a cross-platform application, ConceptDraw DIAGRAM is very secure, handy, free of bloatware and one of the best alternatives to Visio for Mac users.
Critical Path Method in ConceptDraw PROJECT
The Critical Path Method (CPM) is an algorithm for scheduling a set of project activities. It is an important tool for effective project management. ConceptDraw PROJECT implements this method to provide the user with a wide set of project management tools.HelpDesk
How to Generate Tabular Reports in ConceptDraw PROJECT for macOS
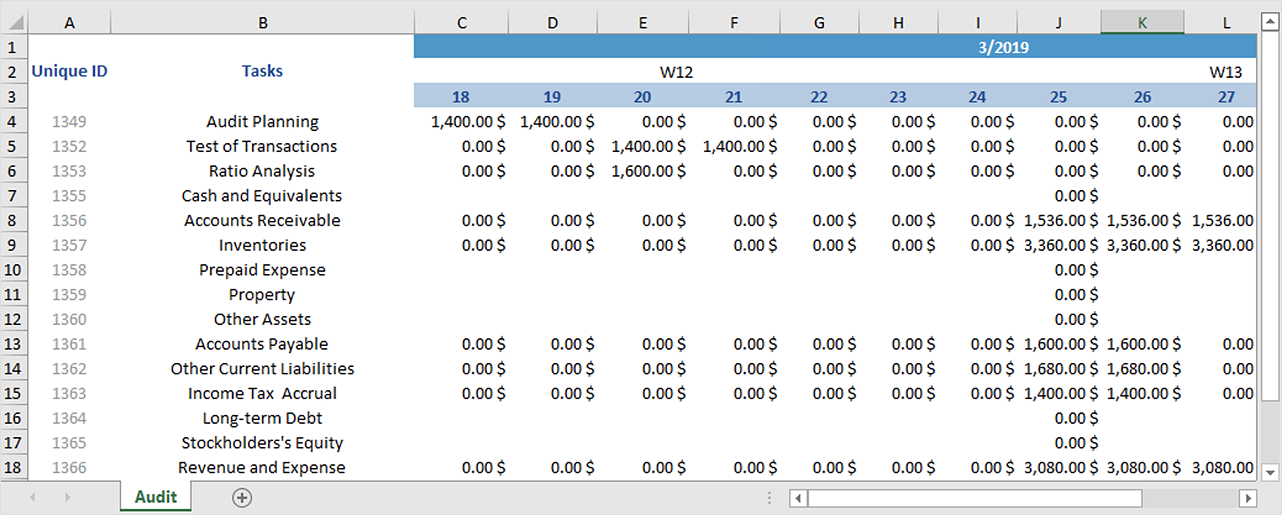
Project reporting is one of the key functions of effective project management. Using regular project reports, project manager can constantly track and analyze the project’s execution. This analytic process can help to ensure that the team reaches the best possible solutions. ConceptDraw PROJECT is a professional software tool for project management with the advanced mechanism of reporting. You can create the set of regular reports on project activities, task statuses, cash flow and assignments in MS Excel format. Mind map reports are also available.Pie Chart Examples and Templates
A pie chart or a circle graph is a circular chart divided into sectors, illustrating numerical proportion. In a pie chart, the arc length of each sector and consequently its central angle and area, is proportional to the quantity it represents. Pie chart examples and templates created using ConceptDraw DIAGRAM software helps you get closer with pie charts and find pie chart examples suite your needs.- Residential Construction Project Schedule Template
- Residential Construction Schedule Template
- Excel Construction Project Timeline Template
- Gantt charts for planning and scheduling projects | Residential ...
- Construction Project Management Templates Excel
- Seating Plans | Construction Project Scheduling Templates For Excel
- Construction Project Timeline Spreadsheet Template Excel
- Construction Scheduling Excel Templates
- Construction Scheduling Template Free
- Microsoft Project Construction Schedule Template


