Process Flowchart
ConceptDraw is Professional business process mapping software for making process flow diagram, workflow diagram, general flowcharts and technical illustrations for business documents. It is includes rich examples, templates, process flowchart symbols. ConceptDraw flowchart maker allows you to easier create a process flowchart. Use a variety of drawing tools, smart connectors, flowchart symbols and shape libraries to create flowcharts of complex processes, process flow diagrams, procedures and information exchange.Basic Flowchart Symbols and Meaning
Flowchart Symbols and Meaning - Provides a visual representation of basic flowchart symbols and their proposed use in professional workflow diagram, standard process flow diagram and communicating the structure of a well-developed web site, as well as their correlation in developing on-line instructional projects. See flowchart's symbols by specifics of process flow diagram symbols and workflow diagram symbols.Flowchart Components
The ConceptDraw Flowchart component includes a set of samples and templates. This geathered as flowchart maker toolbox which focused on drawing flowcharts of any industry standards.Flowcharts
The Flowcharts solution for ConceptDraw DIAGRAM is a comprehensive set of examples and samples in several varied color themes for professionals that need to represent graphically a process. Solution value is added by the basic flow chart template and shapes' libraries of flowchart notation. ConceptDraw DIAGRAM flow chart creator lets one depict the processes of any complexity and length, as well as design the Flowchart either vertically or horizontally.
Cross-Functional Flowchart
Cross-Functional Flowchart - to draw cross functional process maps is by starting with a cross-functional flowchart samples and templates. Easy to draw sample cross functional Process Flow Diagrams. Using a Cross-Functional flowchart is a clear way of showing each team member’s responsibilities and how processes get shared or transferred between different teams and departments.Use cross-functional flowcharts to show the relationship between a business process and the functional units (such as departments) responsible for that process. To create it use the best flowchart maker of ConceptDraw DIAGRAM.
How Cloud Computing Works
The diagrams and schemes are effective way to visualize the Cloud computing, the differences in their types and how Cloud computing works. Thanks to the ConceptDraw DIAGRAM diagramming and vector drawing software extended with Cloud Computing Diagrams solution from the Computers and Network area of ConceptDraw Solution Park, you can design diagrams as easy and quickly as you need.Flowchart Marketing Process. Flowchart Examples
This sample shows the Flowchart that displays the layout and work flow of the cloud marketing platform. This diagram has a style of the marketing brochure. This style displays the central product that is related to the other issues.Using the ready-to-use predesigned objects, samples and templates from the Flowcharts Solution for ConceptDraw DIAGRAM you can create your own professional looking Flowchart Diagrams quick and easy.
Cloud Computing Architecture Diagrams
For documenting the Cloud Computing Architecture with a goal to facilitate the communication between stakeholders are successfully used the Cloud Computing Architecture diagrams. It is convenient and easy to draw various Cloud Computing Architecture diagrams in ConceptDraw DIAGRAM software with help of tools of the Cloud Computing Diagrams Solution from the Computer and Networks Area of ConceptDraw Solution Park.Cross-Functional Flowchart Basics
Don't let your first glance fool you. ConceptDraw is a lot easier to use than it looks. Use its cross-functional templates and library as basics to get started.All you need to know are a few basic steps and terms.
ConceptDraw Arrows10 Technology is a new age in drawing software. Use it for process flows and its new rapid draw feature enables to draw an impressive charts in a seconds.
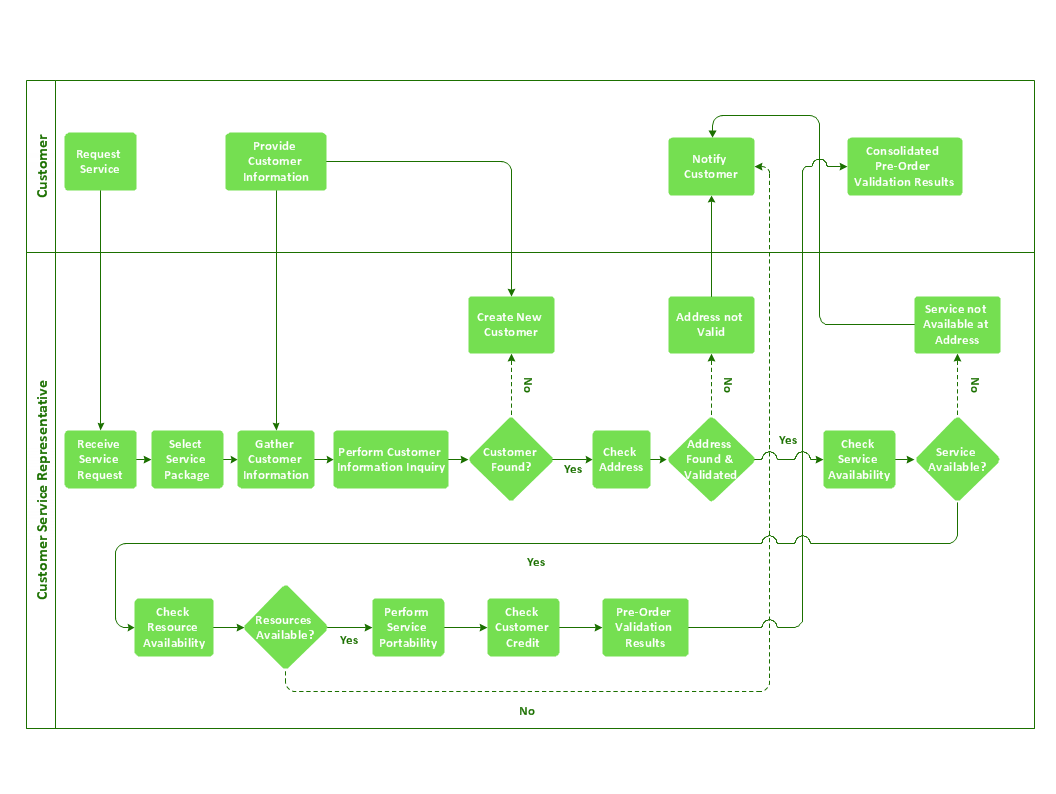
Diagram of a Basic Computer Network. Computer Network Diagram Example
What is a computer network? This is a set of devices and systems that are connected to each other (logically or physically) and communicate with each other. This could include servers, computers, phones, routers, and so on. The size of this network can reach the size of the Internet, and can consist of only two devices connected by a cable.This sample shows the connection scheme of the home WLAN equipment to the Internet.
- Flowchart To Show How A Computer Works
- Call Center Work Flow Chart
- Pc Assembly Flowchart
- Sample Of Flow Chart Of A Computer Shop Business
- Telecommunication Network Diagrams | Basic Flowchart Symbols ...
- Draw To Show How Computer Works
- Draw A Flow Diagram On How Computer And Interpreter Works
- Metropolitan area networks (MAN). Computer and Network ...
- Computer Assembly Company Process Flow Chart
- Introduction To Computer Techniques Beginning From The Flow Chart
- ERD | Entity Relationship Diagrams, ERD Software for Mac and Win
- Flowchart | Basic Flowchart Symbols and Meaning
- Flowchart | Flowchart Design - Symbols, Shapes, Stencils and Icons
- Flowchart | Flow Chart Symbols
- Electrical | Electrical Drawing - Wiring and Circuits Schematics
- Flowchart | Common Flowchart Symbols