How To Create Onion Diagram

Onion Diagram Templates

Stakeholder Onion Diagrams

Use this onion diagram template with ConceptDraw PRO software to design your stakeholder diagrams.
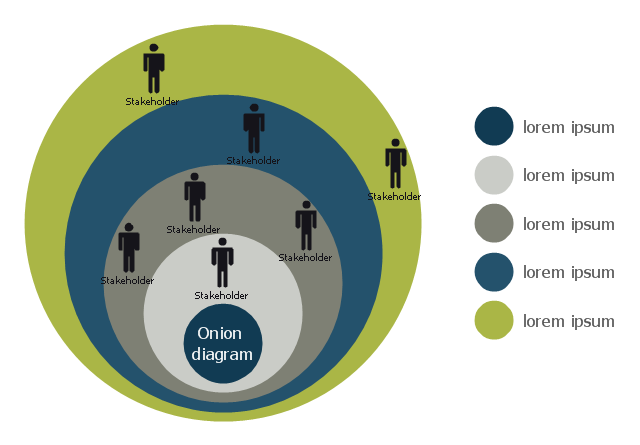
"The Onion Diagram is able to show layers of a complete system in a few circles. Each of the circles is able to represent a component that is dependent upon the component on the inside of it shown by the circle inside of it. The main concept of the diagram is shown by the center circle of the diagram. This chart is used due to the fact that it has a clear visual representation that is easy to read, and it has a strong visual impact." [Onion diagram. Wikipedia]
The stakeholder diagram template "Round onion diagram" is included in the Stakeholder Onion Diagrams solution from the Management area of ConceptDraw Solution Park.
Stakeholder diagram
Stakeholder Management System

Physics Diagrams

 Venn Diagrams
Venn Diagrams are actively used to illustrate simple set relationships in set theory and probability theory, logic and statistics, mathematics and computer science, linguistics, sociology, and marketing. Venn Diagrams are also often used to visually summarize the status and future viability of a project.
 Computer Network Diagrams
Computer Network Diagrams solution extends ConceptDraw PRO software with samples, templates and libraries of vector stencils for drawing the computer network topology diagrams.
Organizational Structure Diagram Software


 Event-driven Process Chain Diagrams
Event-driven Process Chain (EPC) Diagram is a type of flowchart widely used for modeling in business engineering and reengineering, business process improvement, and analysis. EPC method was developed within the Architecture of Integrated Information Systems (ARIS) framework.
 Cisco Network Diagrams
Cisco Network Diagrams solution extends ConceptDraw PRO software with samples, templates and libraries of vector stencils for drawing the Cisco computer network diagrams.
 Workflow Diagrams
Workflow Diagrams solution extends ConceptDraw PRO software with samples, templates and vector stencils library for drawing the work process flowcharts.
 Business Process Diagrams
The Business Process Diagram Solution extends ConceptDraw PRO v10 BPMN software with its RapidDraw interface, templates, samples, and libraries based on the BPMN 1.2 and BPMN 2.0 standards. This powerful solution permits you to visualize easily both simple and complex processes, as well as design business models. The Business Process Diagram solution allows one to quickly develop and document in detail any business processes at any stage of a project’s planning and implementation.
 AWS Architecture Diagrams
The flexible AWS cloud solutions will help you to create reliable applications with a high level of scaling in the AWS cloud, to run your applications and accelerate their work on the level of security. Besides AWS resources are available worldwide and yo
 Fishbone Diagram
Fishbone Diagrams solution extends ConceptDraw PRO software with templates, samples and library of vector stencils for drawing the Ishikawa diagrams for cause and effect analysis.
- Round Onion Diagram Template
- BPR Diagram . Business Process Reengineering Example | Venn ...
- Stakeholder Onion Diagrams | How to Create a Stakeholder Onion ...
- Flow chart Example. Warehouse Flowchart | Flowchart Component ...
- Onion Diagram Templates | How To Create Onion Diagram | Onion ...
- Context Diagram Template | Process Flowchart | Audiovisual system ...
- Visualize Stakeholder Analysis | Stakeholder Onion Diagrams ...
- Target market - Onion diagram | Target diagrams - Vector stencils ...
- Circle-spoke diagram - Target market | Target market - Onion ...
- Marketing mix - Wheel diagram | Target market - Onion diagram ...
- Stakeholder Onion Diagrams | How To Create Onion Diagram ...
- Marketing mix - Wheel diagram | Marketing mix diagram | Target ...
- How To Create Onion Diagram | Onion Diagram Maker | How to ...
- Onion Diagram Templates
- Flowchart Software | Stakeholder Onion Diagram Template | Venn ...
- Target and Circular Diagrams | Design elements - Circular diagrams ...
- Onion Diagram Process Design | Onion Diagram Maker | Onion ...
- How To Create Onion Diagram | Round onion diagram - Template ...
- Stakeholder Management System | Stakeholder Onion Diagrams ...
- Onion Diagram Templates | Stakeholder Onion Diagrams ...