 ConceptDraw Solution Park
ConceptDraw Solution Park collects graphic extensions, examples and learning materials
The library of vector stencils "Fishbone diagrams" contains 13 symbols for drawing the Ishikawa diagrams using the ConceptDraw PRO diagramming and vector drawing software.
"Ishikawa diagrams were popularized by Kaoru Ishikawa in the 1960s, who pioneered quality management processes in the Kawasaki shipyards, and in the process became one of the founding fathers of modern management.
The basic concept was first used in the 1920s, and is considered one of the seven basic tools of quality control. It is known as a fishbone diagram because of its shape, similar to the side view of a fish skeleton." [Ishikawa diagram. Wikipedia]
"The Seven Basic Tools of Quality is a designation given to a fixed set of graphical techniques identified as being most helpful in troubleshooting issues related to quality. They are called basic because they are suitable for people with little formal training in statistics and because they can be used to solve the vast majority of quality-related issues.
The seven tools are:
(1) Cause-and-effect diagram (also known as the "fishbone" or Ishikawa diagram);
(2) Check sheet;
(3) Control chart;
(4) Histogram;
(5) Pareto chart;
(6) Scatter diagram;
(7) Stratification (alternately, flow chart or run chart)." [Seven Basic Tools of Quality. Wikipedia]
The example "Design elements - Fishbone diagram" is included in the Fishbone Diagrams solution from the Management area of ConceptDraw Solution Park.
Ishikawa diagram symbols

 Entity-Relationship Diagram (ERD)
Entity-Relationship Diagram (ERD) solution extends ConceptDraw PRO software with templates, samples and libraries of vector stencils from drawing the ER-diagrams by Chen's and crow’s foot notations.
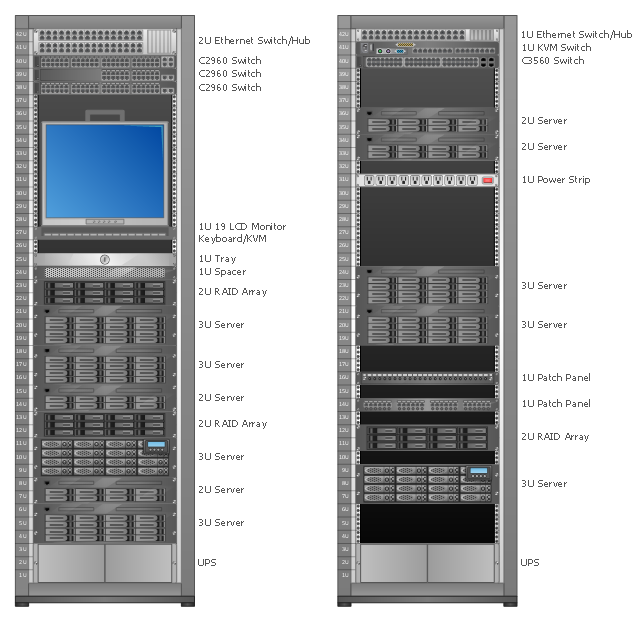
Rack Diagrams visualize the rack mounting of computer hardware and network equipment as the drawing of frontal view of the rack with equipment installed.
They are used for choosing the equipment or racks to buy, and help to organize equipment on the racks virtually, without the real installation.
"A server is a system (software and suitable computer hardware) that responds to requests across a computer network to provide, or help to provide, a network service. Servers can be run on a dedicated computer, which is also often referred to as "the server", but many networked computers are capable of hosting servers. In many cases, a computer can provide several services and have several servers running. ...
Servers often provide essential services across a network, either to private users inside a large organization or to public users via the Internet. Typical computing servers are database server, file server, mail server, print server, web server, gaming server, application server..." [Server (computing). Wikipedia]
This network server rack diagram example was created using the ConceptDraw PRO diagramming and vector drawing software extended with the Rack Diagrams solution from the Computer and Networks area of ConceptDraw Solution Park.
Rack diagram
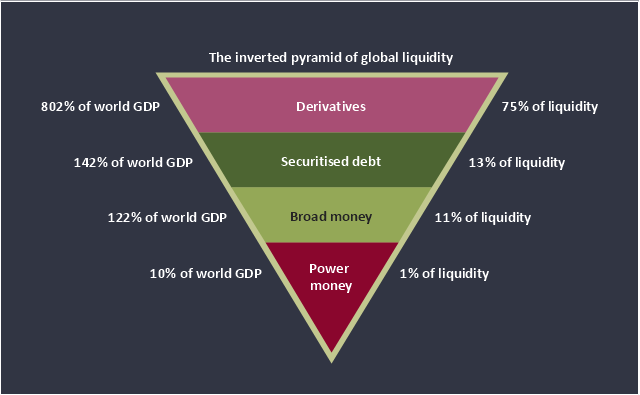
This inverted pyramid diagram of global liquidity shows world GDP and liquidity for 4 levels: derivatives, securitised debt, broad money, and power money.
"In business, economics or investment, market liquidity is a market's ability to facilitate an asset being sold quickly without having to reduce its price very much (or even at all). Equivalently, an asset's market liquidity (or simply "an asset's liquidity") is the asset's ability to sell quickly without having to reduce its price very much. Liquidity is about how big the trade-off is between the speed of the sale and the price it can be sold for. In a liquid market, the trade-off is mild: selling quickly will not reduce the price much. In a relatively illiquid market, selling it quickly will require cutting its price by some amount.
Money, or cash, is the most liquid asset, because it can be "sold" for goods and services instantly with no loss of value. There is no wait for a suitable buyer of the cash. There is no trade-off between speed and value. It can be used immediately to perform economic actions like buying, selling, or paying debt, meeting immediate wants and needs.
If an asset is moderately (or very) liquid, it has moderate (or high) liquidity. In an alternative definition, liquidity can mean the amount of highly liquid assets. If a business has moderate liquidity, it has a moderate amount of very liquid assets. If a business has sufficient liquidity, it has a sufficient amount of very liquid assets and the ability to meet its payment obligations." [Market liquidity. Wikipedia]
This inverted triangle diagram was redesigned using the ConceptDraw PRO diagramming and vector drawing software from Wikimedia Commons file The inverted pyramid of global liquidity.gif. [commons.wikimedia.org/ wiki/ File:The_ inverted_ pyramid_ of_ global_ liquidity.gif]
This triangular chart example is included in the Pyramid Diagrams solution from the Marketing area of ConceptDraw Solution Park.
Inverted pyramid diagram
The Data flow diagram (DFD) example "Payment for goods using UPS code scanner" shows data flow in process of payment for goods in the shop using the MaxiCode scanner.
"MaxiCode is a public domain, machine-readable symbol system originally created and used by United Parcel Service. Suitable for tracking and managing the shipment of packages, it resembles a barcode, but uses dots arranged in a hexagonal grid instead of bars. MaxiCode has been standardised under ISO/ IEC 16023.
A MaxiCode symbol (internally called "Bird's Eye", "Target", "dense code", or "UPS code") appears as a 1 inch square, with a bullseye in the middle, surrounded by a pattern of hexagonal dots. It can store about 93 characters of information, and up to 8 MaxiCode symbols can be chained together to convey more data. The centered symmetrical bullseye is useful in automatic symbol location regardless of orientation, and it allows MaxiCode symbols to be scanned even on a package traveling rapidly." [MaxiCode. Wikipedia]
This example of data flow diagram (Gane & Sarson notation) was created using the ConceptDraw PRO diagramming and vector drawing software extended with the Data Flow Diagrams solution from the Software Development area of ConceptDraw Solution Park.
DFD
---payment-for-goods-using-ups-code-scanner.png--diagram-flowchart-example.png)
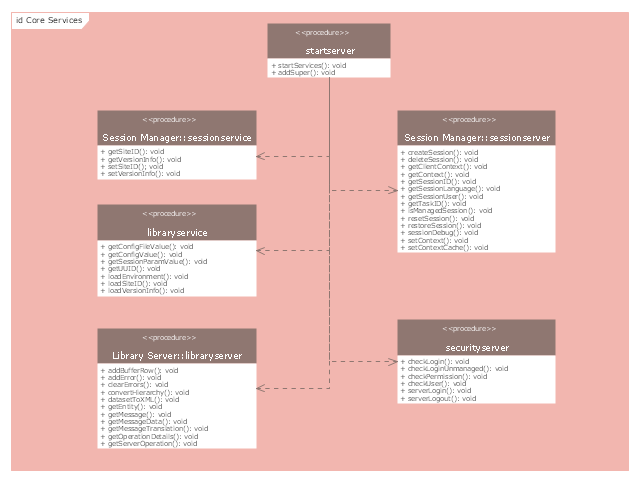
"A server is a system (software and suitable computer hardware) that responds to requests across a computer network to provide, or help to provide, a network service. Servers can be run on a dedicated computer, which is also often referred to as "the server", but many networked computers are capable of hosting servers. In many cases, a computer can provide several services and have several servers running.
Servers operate within a client-server architecture. Servers are computer programs running to serve the requests of other programs, the clients. Thus, the server performs some tasks on behalf of clients. The clients typically connect to the server through the network but may run on the same computer. In the context of Internet Protocol (IP) networking, a server is a program that operates as a socket listener.
Servers often provide essential services across a network, either to private users inside a large organization or to public users via the Internet. Typical computing servers are database server, file server, mail server, print server, web server, gaming server, application server, or some other kind of server.
Numerous systems use this client / server networking model including Web sites and email services. An alternative model, peer-to-peer networking enables all computers to act as either a server or client as needed." [Server (computing). Wikipedia]
The UML component diagram example "Start server" was created using the ConceptDraw PRO diagramming and vector drawing software extended with the Rapid UML solution from the Software Development area of ConceptDraw Solution Park.
UML component diagram
- Explain Lan And Wan With Suitable Diagram
- Explain The Components Of ER Diagram With Suitable Example
- Flowchart Software | Cross Functional Flowchart for Business ...
- Function Of Infotrmation System With Suitable Diagram
- 5 level pyramid model diagram of information systems types ...
- Computer Network Architecture. Computer and Network Examples ...
- Example of DFD for Online Store (Data Flow Diagram ). DFD ...
- Cross-Functional Flowcharts | Office Layout Plans | Software ...
- Entity-Relationship Diagram (ERD) with ConceptDraw PRO ...
- Cross-Functional Flowcharts | Applications | ConceptDraw Solution ...
- Basketball Court Dimensions | Venn Diagram Examples for Problem ...
- Flowchart Software | Good Flow Chart app for Mac | Types of ...
- Pyramid Diagram | Pyramid Diagram | 4 Level pyramid model ...
- Venn Diagram Maker | Venn Diagrams | Venn Diagram Template for ...
- Data Modeling with Entity Relationship Diagram
- Active Directory diagrams with ConceptDraw PRO | Active Directory ...
- Explain Pan Network Suitable Diagram
- Design elements - ERD (crow's foot notation) | Entity Relationship ...
- Flowchart Marketing Process. Flowchart Examples | Sales Process ...
- 5-Set Venn diagram - Template | Multi Layer Venn Diagram . Venn ...