Data Flow Diagram

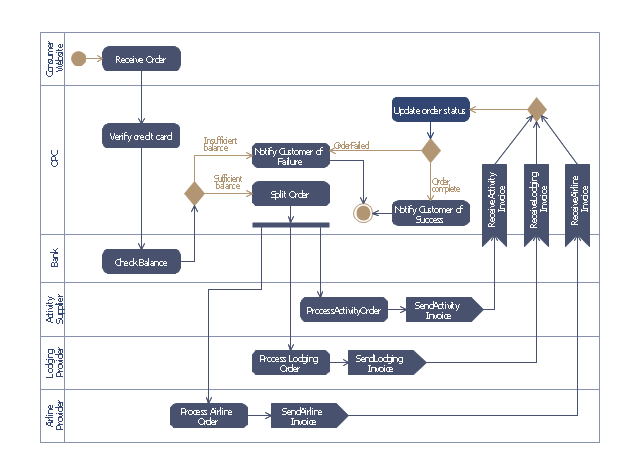
This purchase order processing UML activity diagram was created on the base of activity diagram from the software architecture documentation wiki of the Software Engineering Institute (SEI) of Carnegie Mellon University (CMU).
[wiki.sei.cmu.edu/ sad/ index.php/ Image:PurchaseOrderActivityDiagram.png]
"A purchase order (PO) is a commercial document and first official offer issued by a buyer to a seller, indicating types, quantities, and agreed prices for products or services. Acceptance of a purchase order by a seller forms a contract between the buyer and seller, so no contract exists until the purchase order is accepted. It is used to control the purchasing of products and services from external suppliers.
Creating a purchase order is typically the first step of the purchase to pay process in an ERP system." [Purchase order. Wikipedia]
This purchase order processing UML activity diagram example was created using the ConceptDraw PRO diagramming and vector drawing software extended with the ATM UML Diagrams solution from the Software Development area of ConceptDraw Solution Park.
UML activity diagram of purchase order processing
Diagramming Software for Design UML Activity Diagrams
")

Diagramming Software for Design UML Collaboration Diagrams

Data Modeling Diagram

 Rapid UML
Rapid UML solution extends ConceptDraw PRO software with templates, samples and libraries of vector stencils for quick drawing the UML diagrams using Rapid Draw technology.
UML Diagram

Communication Diagram UML2.0 / Collaboration UML1.x

UML Business Process

Flowchart Definition

- Activity Diagram For Order Management System
- Order Management System Uml Case Diagram Examples
- SYSML | State Diagram Of Order Management System
- Collaboration Diagram Of Order Management System
- Object Diagram For Order Management System
- Activity Diagrams For Sales Order Processing System Using Object
- Purchase order processing UML activity diagram | Uml Activity Order ...
- Activity Diagram For Order Processing System
- Use Case Diagram For Purchase Order System
- SYSML | Order Management System State Diagram