Diagramming Software for Design UML Collaboration Diagrams


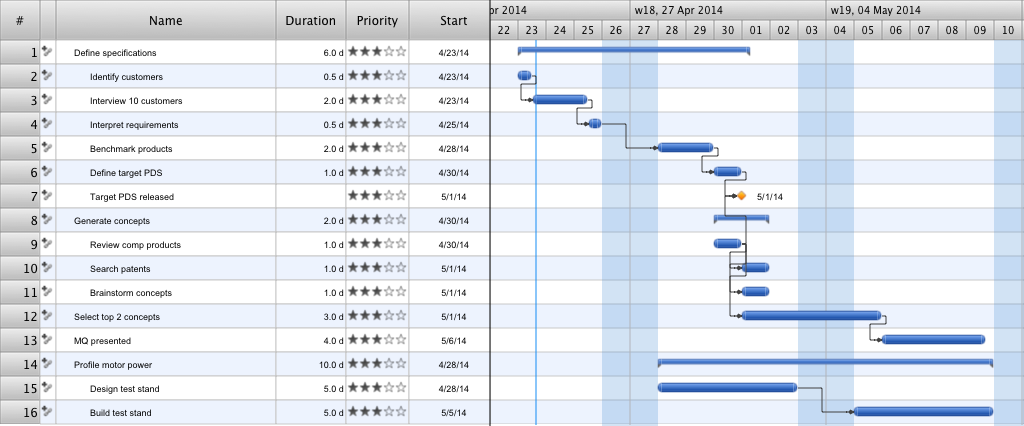
Gantt Chart Software

Collaboration in a Project Team

Gantt Chart Software

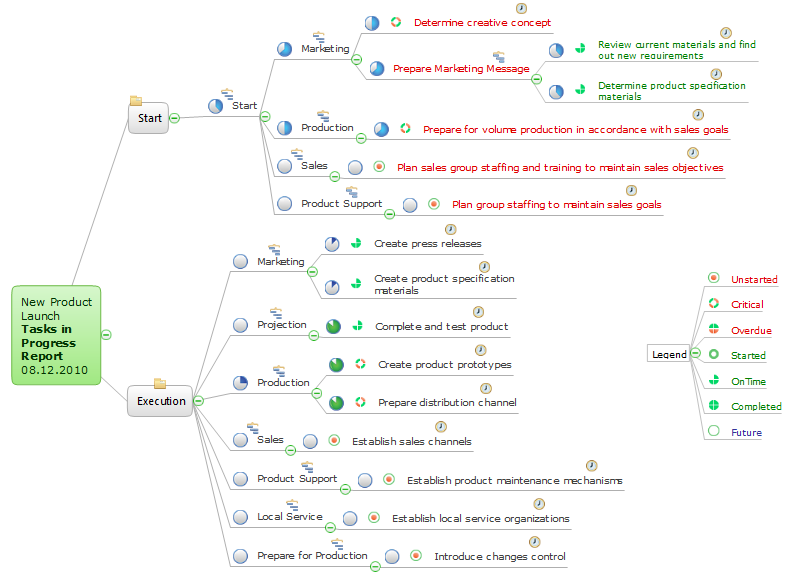
How To Show Project Progress Peport on Web

Gantt Chart Templates
HelpDesk
How to Get Started with ConceptDraw Solution for Evernote

Business Process Modeling Notation

HelpDesk
How to Manage a Multiple Project Participants Responsibilities With To-Do Mind Maps

HelpDesk
How to Quickly Make a Project from a Mind Map

HelpDesk
How to Make SWOT Analysis in a Word Document

Software and Database Design with ConceptDraw DIAGRAM

Software Diagram Examples and Templates

How To Create Project Report

UML Notation

- PM Dashboards | Gantt Chart Software | Collaboration in a Project ...
- How To Implement Collaborative Project Management ...
- How to Create Presentation of Your Project Gantt Chart | How To ...
- Schedule pie chart - Daily action plan | How To Implement ...
- Timeline Chart Collaborative Process
- Project — Assigning Resources | How To Implement Collaborative ...
- How To Implement Collaborative Project Management ...
- Product Overview | Gantt chart examples | Expand collaboration ...
- How to Create Presentation of Your Project Gantt Chart | Remote ...
- How To Implement Collaborative Project Management ...
- Quality Project Management with Mind Maps | How To Implement ...
- Project —Task Trees and Dependencies | How To Implement ...
- Project — Assigning Resources | How To Implement Collaborative ...
- Gant Chart in Project Management | How To Create a FlowChart ...
- How to Discover Critical Path on a Gantt Chart | Gantt charts for ...
- How To Implement Collaborative Project Management
- How to Report Task's Execution with Gantt Chart | How to Create ...
- Gantt chart examples | Gant Chart in Project Management | Gantt ...
- How To Use Collaboration Tool in Project Management ...
- Gant Chart in Project Management | Gantt chart examples | Business ...