 Audit Flowcharts
Audit flowcharts solution extends ConceptDraw DIAGRAM software with templates, samples and library of vector stencils for drawing the audit and fiscal flow charts.
 Accounting Flowcharts
Accounting Flowcharts solution extends ConceptDraw DIAGRAM software with templates, samples and library of vector stencils for drawing the accounting flow charts.
 Venn Diagrams
Venn Diagrams are actively used to illustrate simple set relationships in set theory and probability theory, logic and statistics, mathematics and computer science, linguistics, sociology, and marketing. Venn Diagrams are also often used to visually summarize the status and future viability of a project.
 Accounting Flowcharts
Accounting Flowcharts solution extends ConceptDraw DIAGRAM software with templates, samples and library of vector stencils for drawing the accounting flow charts.
Stakeholder Management System

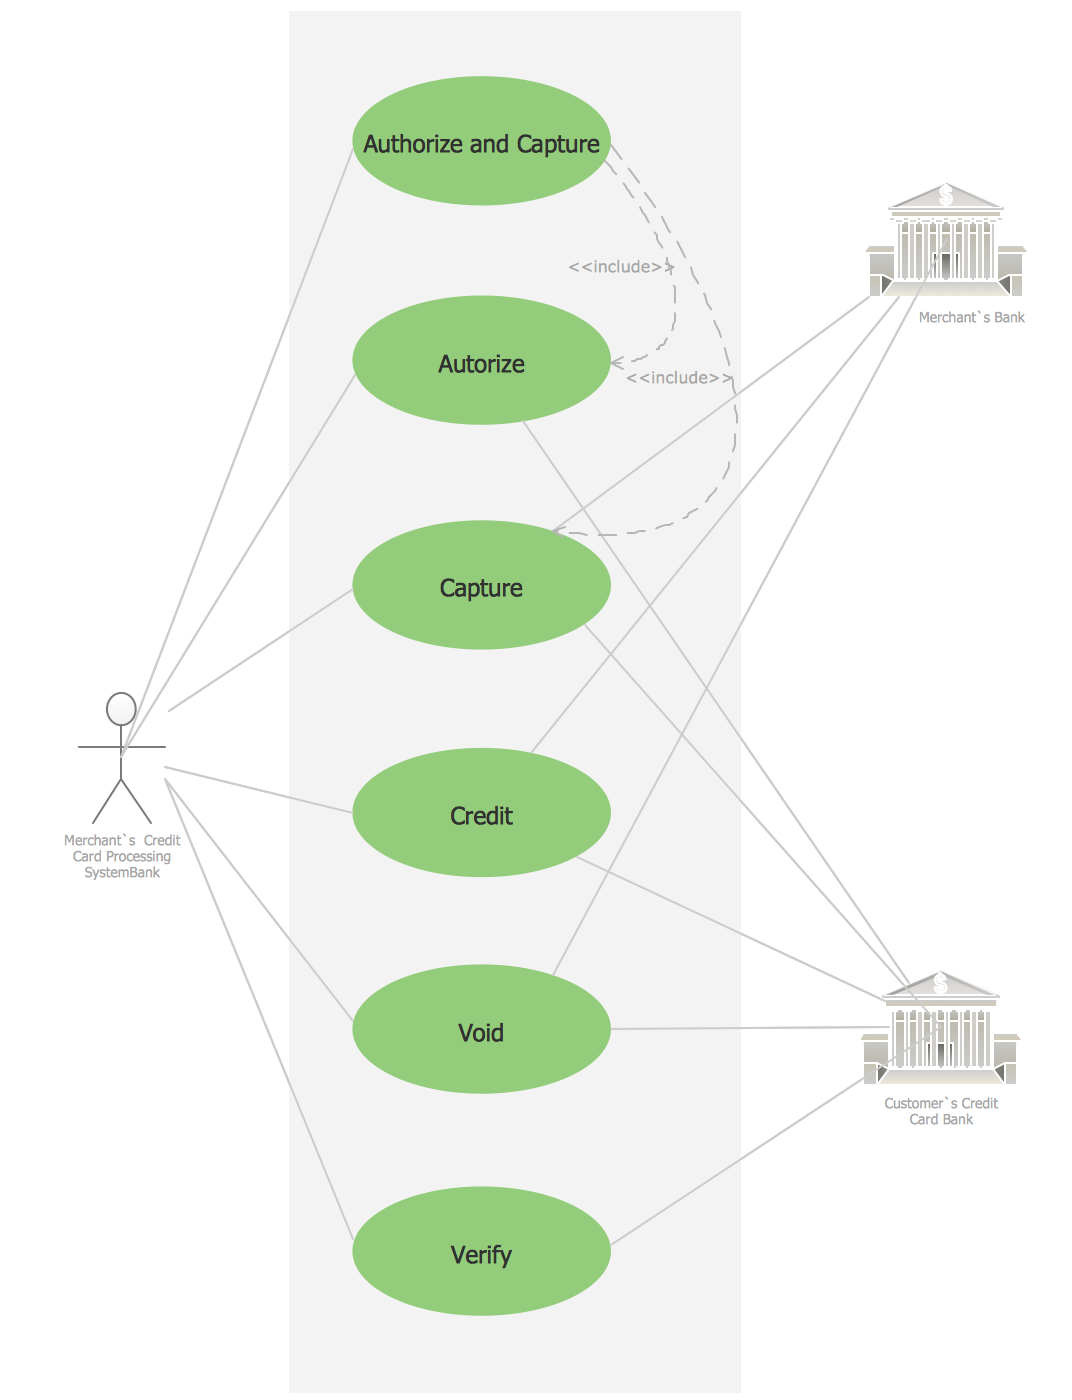
Credit Card Processing System UML Diagram
Data Flow Diagram Process

 Interactive Voice Response Diagrams
Interactive Voice Response Diagrams solution extends ConceptDraw DIAGRAM software with samples, templates and libraries of ready-to-use vector stencils that help create Interactive Voice Response (IVR) diagrams illustrating in details a work of interactive voice response system, the IVR system’s logical and physical structure, Voice-over-Internet Protocol (VoIP) diagrams, and Action VoIP diagrams with representing voice actions on them, to visualize how the computers interact with callers through voice recognition and dual-tone multi-frequency signaling (DTMF) keypad inputs.
 Event-driven Process Chain Diagrams
Event-Driven Process Chain Diagrams solution extends ConceptDraw DIAGRAM functionality with event driven process chain templates, samples of EPC engineering and modeling the business processes, and a vector shape library for drawing the EPC diagrams and EPC flowcharts of any complexity. It is one of EPC IT solutions that assist the marketing experts, business specialists, engineers, educators and researchers in resources planning and improving the business processes using the EPC flowchart or EPC diagram. Use the EPC solutions tools to construct the chain of events and functions, to illustrate the structure of a business process control flow, to describe people and tasks for execution the business processes, to identify the inefficient businesses processes and measures required to make them efficient.
 Business and Finance
Use Business and Finance solution to make professional-looking documents, presentations and websites, business, finance, advertising, and project management illustrations, or any designs that requires clipart of currency, office, business, advertising, management, marketing, people, time, post, contacts, collaboration, etc.
 Fishbone Diagrams
The Fishbone Diagrams solution extends ConceptDraw DIAGRAM software with the ability to easily draw the Fishbone Diagrams (Ishikawa Diagrams) to clearly see the cause and effect analysis and also problem solving. The vector graphic diagrams produced using this solution can be used in whitepapers, presentations, datasheets, posters, and published technical material.
 PM Personal Time Management
PM Personal Time Management solution extends the ConceptDraw Solution Park and all ConceptDraw Office suite products providing every project participant with tools and features allowing tracking timeframe, workspace and role in a project with the aid of Microreports, calendars, and project To-Do lists. PM Personal Time Management solution makes the collaborative work easier and improves personal performance, now each project participant stays informed about the task lists, calendars and future tasks for itself and its colleagues. Be effective in project management and personal time management, generate easily your personal To-Do lists, personal calendars, personal assignment lists, project checklists, and communicate with your colleagues using e-mail and sending project Microreports via e-mail with one click.
 Entity-Relationship Diagram (ERD)
An Entity-Relationship Diagram (ERD) is a visual presentation of entities and relationships. That type of diagrams is often used in the semi-structured or unstructured data in databases and information systems. At first glance ERD is similar to a flowch
 Entity-Relationship Diagram (ERD)
Entity-Relationship Diagram (ERD) solution extends ConceptDraw DIAGRAM software with templates, samples and libraries of vector stencils from drawing the ER-diagrams by Chen's and crow’s foot notations.
 Total Quality Management TQM Diagrams
Total Quality Management Diagrams solution extends ConceptDraw DIAGRAM software with samples, templates and vector stencils library for drawing the TQM flowcharts.
- Class Diagram For Finance Management
- Financial System Class Diagram
- Class Diagram For Financial Management System
- Class Diagram For Financial Accounting System
- Class Diagram For Student Registration Process
- Sequence Diagram Financial Management
- Class Diagram Example For Student Registration System
- Class Diagram For Buissness Management
- Sequence Diagram For Finance Management
- Class Diagram For Student Application System
- Class Diagram Of Database Required For Finance Management ...
- Financial Management System Dfd
- Usecase Diagrams For Finance Management Systems
- Draw Package Diagram For Student Management System
- Sequence Diagram For Finance Management System
- Class Diagram For Student Information
- Dfd Of Financial Management System
- Block Diagram For Financial Management System
- Activity Diagram For Financial Accounting System