UML Class Diagram Generalization Example UML Diagrams

UML Class Diagram Tutorial

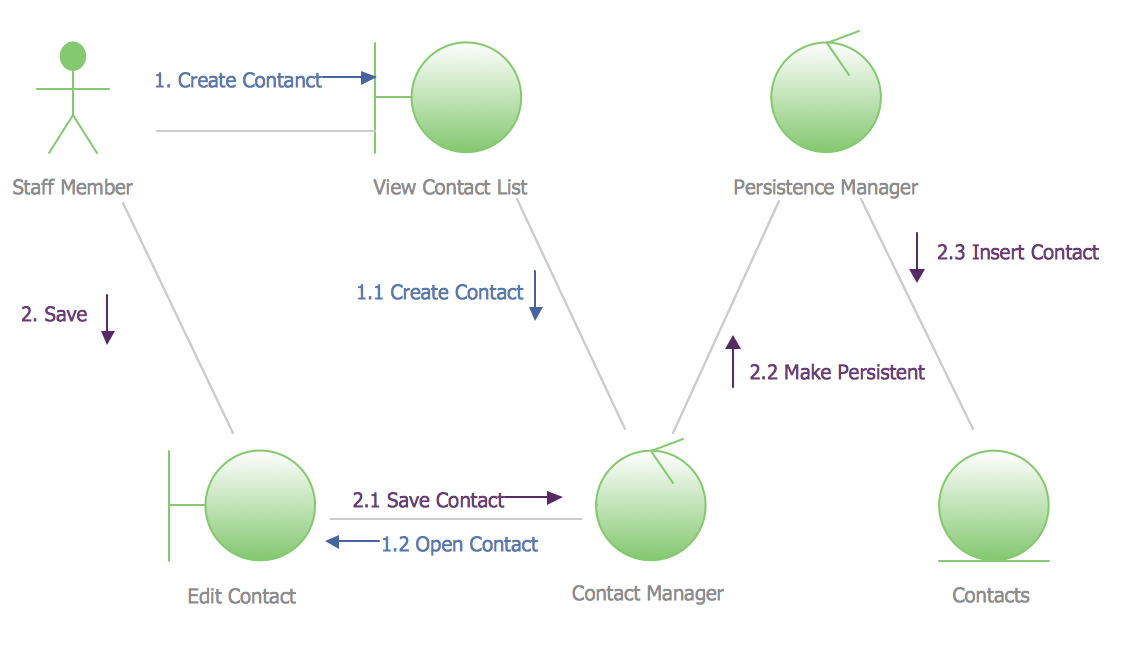
Jacobson Use Cases Diagram

 Cafe and Restaurant Floor Plans
Restaurants and cafes are popular places for recreation, relaxation, and are the scene for many impressions and memories, so their construction and design requires special attention. Restaurants must to be projected and constructed to be comfortable and e
UML Collaboration Diagram Example Illustration
UML Class Diagram Example - Buildings and Rooms

 Event-driven Process Chain Diagrams
Event-Driven Process Chain Diagrams solution extends ConceptDraw DIAGRAM functionality with event driven process chain templates, samples of EPC engineering and modeling the business processes, and a vector shape library for drawing the EPC diagrams and EPC flowcharts of any complexity. It is one of EPC IT solutions that assist the marketing experts, business specialists, engineers, educators and researchers in resources planning and improving the business processes using the EPC flowchart or EPC diagram. Use the EPC solutions tools to construct the chain of events and functions, to illustrate the structure of a business process control flow, to describe people and tasks for execution the business processes, to identify the inefficient businesses processes and measures required to make them efficient.
How To Plan and Implement Projects Faster

 Fishbone Diagrams
The Fishbone Diagrams solution extends ConceptDraw DIAGRAM software with the ability to easily draw the Fishbone Diagrams (Ishikawa Diagrams) to clearly see the cause and effect analysis and also problem solving. The vector graphic diagrams produced using this solution can be used in whitepapers, presentations, datasheets, posters, and published technical material.
 Fault Tree Analysis Diagrams
This solution extends ConceptDraw DIAGRAM.5 or later with templates, fault tree analysis example, samples and a library of vector design elements for drawing FTA diagrams (or negative analytical trees), cause and effect diagrams and fault tree diagrams.
Create Sophisticated Professional Diagrams - Simply

Network Diagram Software. LAN Network Diagrams. Physical Office Network Diagrams


Pyramid Diagram

 Network Layout Floor Plans
Network Layout Floor Plans solution extends ConceptDraw DIAGRAM software functionality with powerful tools for quick and efficient documentation the network equipment and displaying its location on the professionally designed Network Layout Floor Plans. Never before creation of Network Layout Floor Plans, Network Communication Plans, Network Topologies Plans and Network Topology Maps was not so easy, convenient and fast as with predesigned templates, samples, examples and comprehensive set of vector design elements included to the Network Layout Floor Plans solution. All listed types of plans will be a good support for the future correct cabling and installation of network equipment.
- Cafe and Restaurant Floor Plans | UML Class Diagram ...
- Class Diagram For Online Restaurant System
- Cafe and Restaurant Floor Plans | UML Class Diagram Tutorial ...
- UML Collaboration Diagram Example Illustration | UML Class ...
- Cafe and Restaurant Floor Plans | UML Class Diagram Example ...
- Online Restaurantanagement Syst Class Diagram
- Jacobson Use Cases Diagram | Cafe and Restaurant Floor Plans ...
- Draw A Class Diagram For Online Restaurant System
- UML Class Diagram Tutorial | How To Create Restaurant Floor Plan ...
- Draw Class Diagram For Online Restaurant Management In Uml
- Use Case Diagram For Online Restaurant Management System
- UML Class Diagram . Design Elements | UML Sample Project | Cafe ...
- Class Diagram For Restaurant System
- UML Collaboration Diagram Example Illustration | UML Class ...
- Winter Sports | Ice Hockey | Cafe and Restaurant Floor Plans | Class ...
- UML Class Diagram Generalization Example UML Diagrams | UML ...
- Restaurant Floor Plans | UML Class Diagram Generalization ...
- UML Class Diagram Example - Apartment Plan | How To Create ...
- Draw Class Diagram For Online Restorunt System
- Class Diagram For Business Restaurant