HelpDesk
How to Draw a Circular Arrows Diagram Using ConceptDraw PRO

 Circular Arrows Diagrams
Circular Arrows Diagrams solution extends ConceptDraw PRO v10 with extensive drawing tools, predesigned samples, Circular flow diagram template for quick start, and a library of ready circular arrow vector stencils for drawing Circular Arrow Diagrams, Segmented Cycle Diagrams, and Circular Flow Diagrams. The elements in this solution help managers, analysts, business advisers, marketing experts, scientists, lecturers, and other knowledge workers in their daily work.
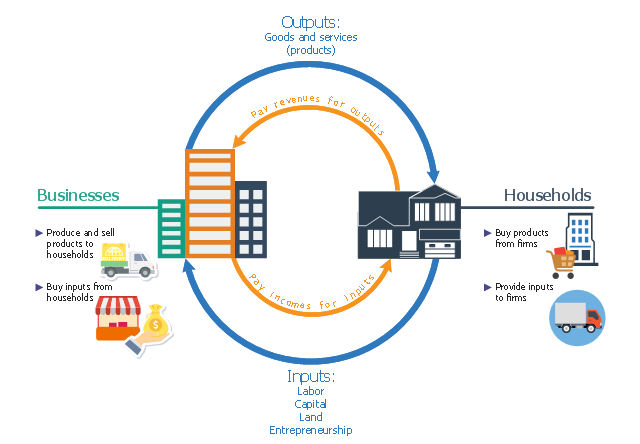
This business infographic sample shows the circular flow of inputs and outputs between businesses and households. It was designed on the base of the Wikimedia Commons file: Fundamentals of Business - Fig. 2.1 - Circular flow of inputs and outputs.jpg. [commons.wikimedia.org/ wiki/ File:Figure_ 2.1_ Circular_ flow_ of_ inputs_ and_ outputs.jpg]
This file is licensed under the Creative Commons Attribution 4.0 International license. [creativecommons.org/ licenses/ by/ 4.0/ deed.en]
"Many of the factors of production (or resources) are provided to businesses by households. For example, households provide businesses with labor (as workers), land and buildings (as landlords), and capital (as investors). In turn, businesses pay households for these resources by providing them with income, such as wages, rent, and interest. The resources obtained from households are then used by businesses to produce goods and services, which are sold to the same households that provide businesses with revenue. The revenue obtained by businesses is then used to buy additional resources, and the cycle continues." [saylor.org/ site/ textbooks/ Exploring%20 Business.pdf]
The business infographic example "Circular flow of inputs and outputs" was designed using ConceptDraw PRO diagramming and vector drawing software extended with the Business and Finance solution from Illustration area of ConceptDraw Solution Park.
Infographic
 Basic Circular Arrows Diagrams
This solution extends ConceptDraw PRO v10 (or later) with samples, templates, and a library of vector stencils for drawing circular arrow diagrams.
 Target and Circular Diagrams
This solution extends ConceptDraw PRO software with samples, templates and library of design elements for drawing the Target and Circular Diagrams.
 ConceptDraw Solution Park
ConceptDraw Solution Park collects graphic extensions, examples and learning materials
 Circle-Spoke Diagrams
Examples of subject areas that are well suited to this approach are marketing, business, products promotion, process modeling, market, resource, time, and cost analysis. Circle-Spoke Diagrams are successfully used in presentations, conferences, management documents, magazines, reportages, reviews, reports, TV, and social media.
HelpDesk
How To Create a Visio Circle-Spoke Diagram Using ConceptDraw PRO

 What are Infographic Area
Solutions of the area What is Infographics from ConceptDraw Solution Park collect templates, samples and vector stencils libraries with design elements for the drawing information graphics.
 Basic Circle-Spoke Diagrams
Basic circle-spoke diagrams are well suited for marketing, management documents, and presentations.
 Business Infographics Area
ConceptDraw Business Infographics Solutions helps you to design eye-catching marketing infographics, on subjects such as content marketing, education, IT, social media marketing, and marketing plans; allowing you to represent, share and explain various pi
- Marketing Plan Infographic | HVAC Marketing Plan | Marketing plan ...
- Target Diagram | Marketing Infographics | Target and Circular ...
- Circular Infographic Chart Editable Template Online
- Marketing plan - Circular diagram | Marketing Plan Infographic ...
- Circle Text Blocks
- Marketing mix - Wheel diagram | Target market | Use of social media ...
- Content Marketing Infographics | Content marketing cycle - Ring ...
- Spatial Infographics | Accounting Flowcharts | Cross-Functional ...
- Content Marketing Infographics | Marketing Infographics | Marketing ...
- Top iPad Business Process Diagrams Apps | Tools to Create Your ...
- How to Create a Venn Diagram in ConceptDraw PRO | Marketing ...
- Infographic Maker | Map Infographic Maker | Superb Examples of ...
- Energy resources diagram | CMP adaptive management cycle ...
- Design elements - Bulleted and numbered lists | Design elements ...
- Infographic Generator | How to Create a Timeline Diagram in ...
- ConceptDraw Solution Park | Target and Circular Diagrams ...
- Internet Marketing Infographic | Map Infographic Creator ...
- Map Infographic Creator | Map Infographic Maker | Infographic ...
- Process Flowchart | Design Pictorial Infographics . Design ...
- Sample Pictorial Chart. Sample Infographics | Business process ...