This circle diagram sample was redesigned from the Wikimedia Commons file: Research cycle.png. "Some of the basic elements of the scientific method, arranged in a cycle to emphasize that it is an iterative process." [commons.wikimedia.org/ wiki/ File:Research_ cycle.png]
This file is licensed under the Creative Commons Attribution 2.0 Generic license. [creativecommons.org/ licenses/ by/ 2.0/ deed.en]
"The scientific method is a body of techniques for investigating phenomena, acquiring new knowledge, or correcting and integrating previous knowledge. To be termed scientific, a method of inquiry must be based on empirical and measurable evidence subject to specific principles of reasoning. ...
Four essential elements of the scientific method are iterations, recursions, interleavings, or orderings of the following:
(1) Characterizations (observations, definitions, and measurements of the subject of inquiry).
(2) Hypotheses (theoretical, hypothetical explanations of observations and measurements of the subject).
(3) Predictions (reasoning including logical deduction from the hypothesis or theory).
(4) Experiments (tests of all of the above)...
A linearized, pragmatic scheme of the four points above is sometimes offered as a guideline for proceeding:
(1) Define a question.
(2) Gather information and resources (observe).
(3) Form an explanatory hypothesis.
(4) Test the hypothesis by performing an experiment and collecting data in a reproducible manner.
(5) Analyze the data.
(6) Interpret the data and draw conclusions that serve as a starting point for new hypothesis.
(7) Publish results.
(8) Retest (frequently done by other scientists).
The iterative cycle inherent in this step-by-step method goes from point 3 to 6 back to 3 again." [Scientific method. Wikipedia]
The circle diagram example "Research cycle" was created using the ConceptDraw PRO diagramming and vector drawing software extended with the Target and Circular Diagrams solution from the Marketing area of ConceptDraw Solution Park.
www.conceptdraw.com/ solution-park/ marketing-target-and-circular-diagrams
Circle diagram

3 Circle Venn. Venn Diagram Example

Circles Venn Diagram

 Circle-Spoke Diagrams
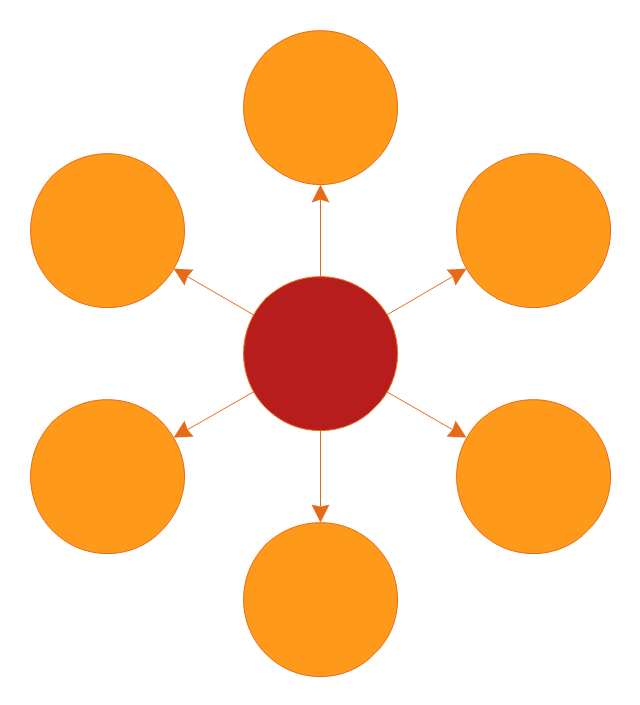
Examples of subject areas that are well suited to this approach are marketing, business, products promotion, process modeling, market, resource, time, and cost analysis. Circle-Spoke Diagrams are successfully used in presentations, conferences, management documents, magazines, reportages, reviews, reports, TV, and social media.
Basic Circles Venn Diagram. Venn Diagram Example

The vector stencils library "Circular diagrams" contains 42 templates of circular diagrams: circular arrow diagram, circular motion diagram, arrow ring chart, doughnut chart (donut chart), circle pie chart, diamond pie chart, circle diagram, pie chart, ring chart, loop diagram, block loop diagram, arrow loop circle, crystal diagram, triangular diagram, diamond diagram, pentagon diagram, hexagon diagram, heptagon diagram, cycle diagram (cycle chart), stacked Venn diagram (onion diagram), arrow circle diagram.
Use these shapes to illustrate your marketing and sales documents, presentations, webpages and infographics in the ConceptDraw PRO diagramming and vector drawing software extended with the Target and Circular Diagrams solution from the Marketing area of ConceptDraw Solution Park.
www.conceptdraw.com/ solution-park/ marketing-target-and-circular-diagrams
Circular arrow diagram 1
Circular arrow diagram 2
Arrow ring chart
Doughnut chart

Diamond pie chart

Pie chart

Circle diagram

Circle pie chart 2

Circle pie chart 1

Ring chart 1 - 3 elements

Ring chart 1 - 4 elements

Ring chart 1 - 5 elements

Ring chart 1 - 6 elements

Ring chart 1 - 7 elements

Ring chart 2 - 3 elements

Ring chart 2 - 4 elements

Ring chart 2 - 5 elements

Ring chart 2 - 6 elements

Ring chart 2 - 7 elements

Crystal diagram - 3 elements

Crystal diagram - 4 elements

Crystal diagram - 5 elements

Crystal diagram - 6 elements

Crystal diagram - 7 elements

Stacked Venn diagram - 4

Stacked Venn diagram - 5

Stacked Venn diagram - 6

Stacked Venn diagram - 7

Basic loop diagram

Block loop diagram

Arrow loop circle
Arrow loop - 3 circles
Arrow loop - 4 circles
Arrow loop - 5 circles
Arrow loop - 6 circles
Arrow loop - 7 circles
Arrow circle diagram - 3
Arrow circle diagram - 4
Stacked Venn diagram - 3

Arrow circle diagram - 5
Arrow circle diagram - 6
Arrow circle diagram - 7
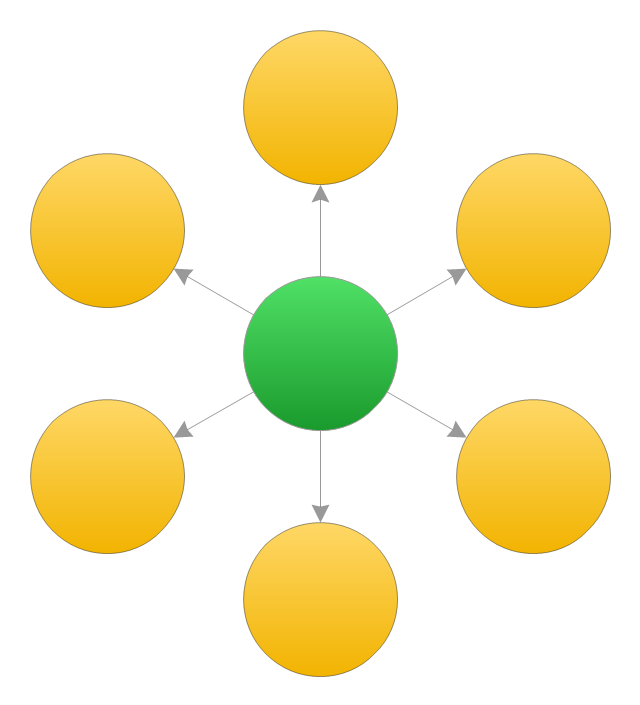
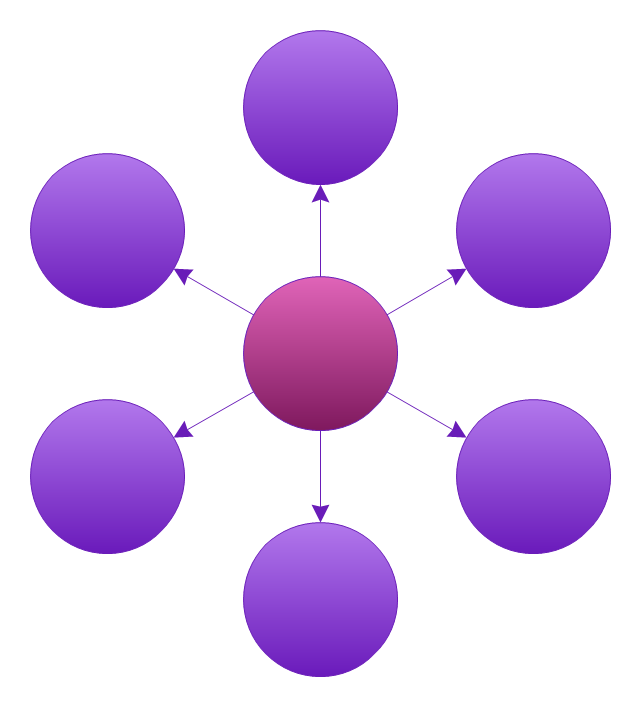
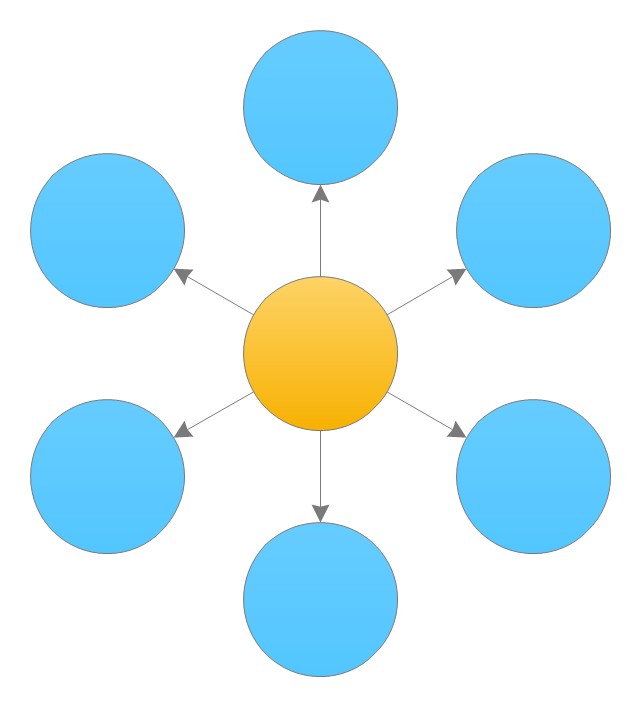
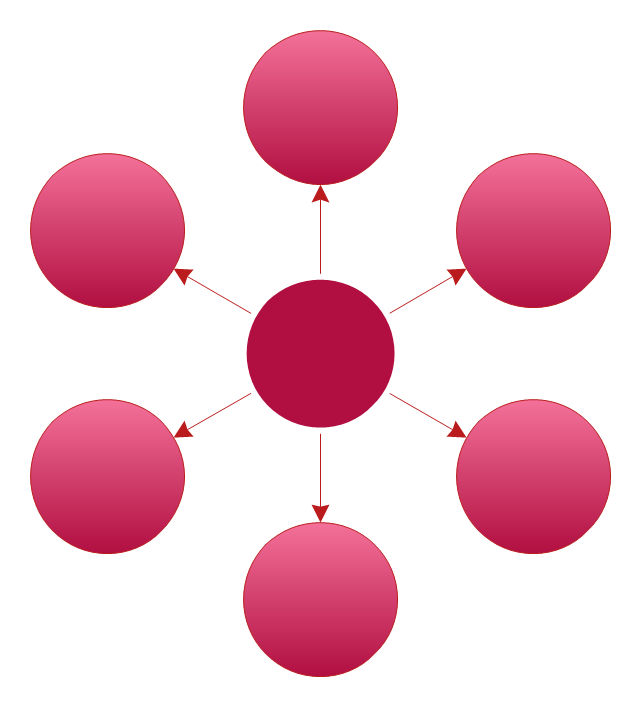
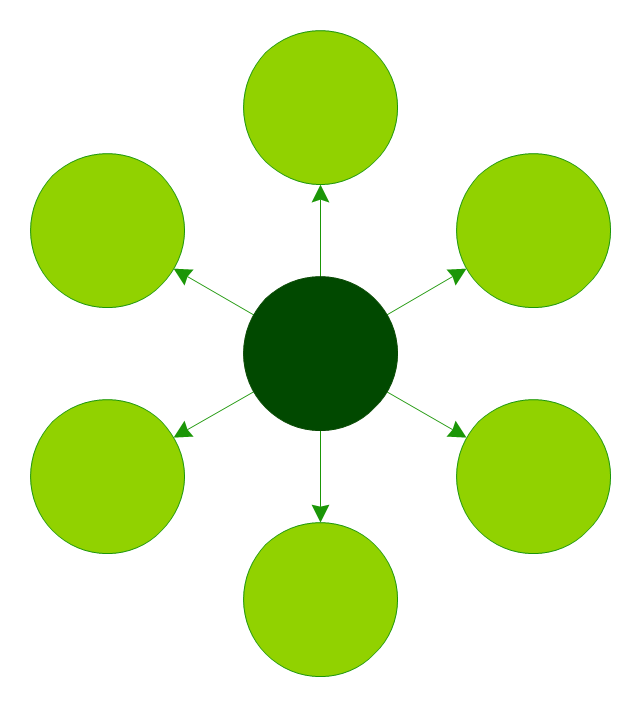
 Basic Circle-Spoke Diagrams
Basic circle-spoke diagrams are well suited for marketing, management documents, and presentations.
Flowchart design. Flowchart symbols, shapes, stencils and icons


Basic Flowchart Symbols and Meaning


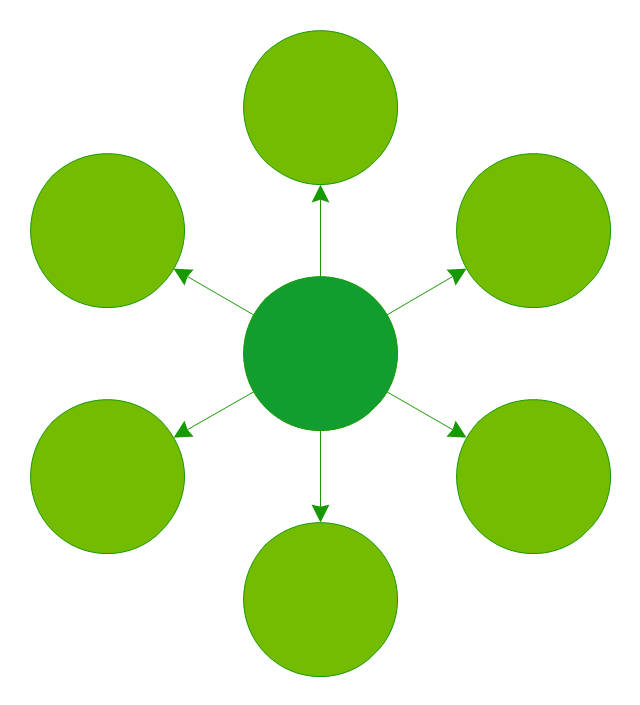
The vector stencils library "Circle-spoke diagram" contains 8 templates of circle-spoke diagrams.
Use these shapes to draw your circle spoke diagrams in the ConceptDraw PRO diagramming and vector drawing software extended with the Circle-Spoke Diagrams solution from the area "What is a Diagram" of ConceptDraw Solution Park.
Use these shapes to draw your circle spoke diagrams in the ConceptDraw PRO diagramming and vector drawing software extended with the Circle-Spoke Diagrams solution from the area "What is a Diagram" of ConceptDraw Solution Park.
Circle-Spoke Diagram 1
Circle-Spoke Diagram 2
Circle-Spoke Diagram 3
Circle-spoke diagram 4
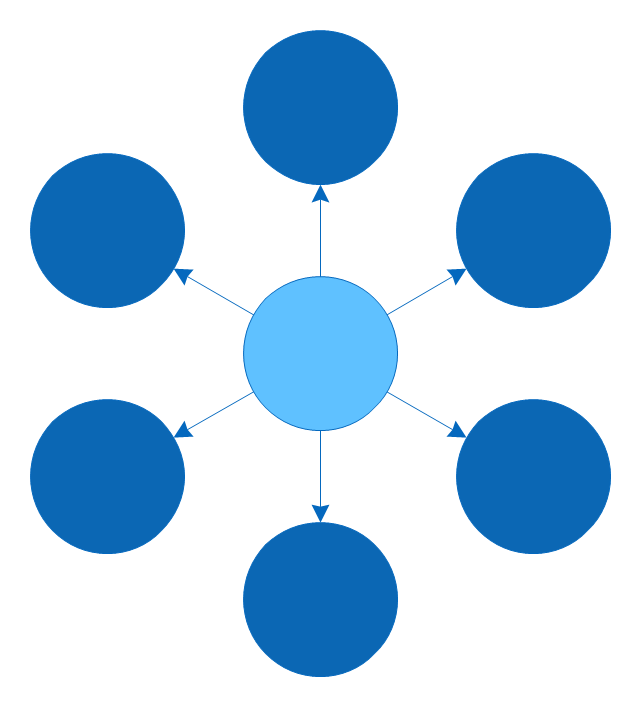
Circle-Spoke Diagram 5
Circle-Spoke Diagram 6
Circle-Spoke Diagram 7
Circle-Spoke Diagram 8
HelpDesk
How to Draw a Circle-Spoke Diagram Using ConceptDraw PRO

The vector stencils library "Circular arrows diagrams" contains 20 templates of circular arrows diagrams and arrow donut charts.
Use these shapes to draw your circular arrows diagrams in the ConceptDraw PRO diagramming and vector drawing software.
The vector stencils library "Circular arrows diagrams" is included in the Circular Arrows Diagrams solution from the area "What is a Diagram" of ConceptDraw Solution Park.
Use these shapes to draw your circular arrows diagrams in the ConceptDraw PRO diagramming and vector drawing software.
The vector stencils library "Circular arrows diagrams" is included in the Circular Arrows Diagrams solution from the area "What is a Diagram" of ConceptDraw Solution Park.
Circular arrows diagram - 3 elements

Circular arrows diagram - 4 elements

Circular arrows diagram - 5 elements

Circular arrows diagram - 6 elements

Circular arrows diagram - 7 elements

Arrows donut chart - 3 slices

Arrows donut chart - 4 slices

Arrows donut chart - 5 slices

Arrows donut chart - 6 slices

Arrows donut chart - 7 slices

Ring chart - 3 elements

Ring chart - 4 elements

Ring chart - 5 elements

Ring chart - 6 elements

Ring chart - 7 elements

Arrow circle diagram - 3 elements
Arrow circle diagram - 4 elements
Arrow circle diagram - 5 elements
Arrow circle diagram - 6 elements
Arrow circle diagram - 7 elements
Venn Diagram Examples for Problem Solving. Venn Diagram as a Truth Table

 Pie Charts
Pie Charts are extensively used in statistics and business for explaining data and work results, in mass media for comparison (i.e. to visualize the percentage for the parts of one total), and in many other fields. The Pie Charts solution for ConceptDraw PRO v10 offers powerful drawing tools, varied templates, samples, and a library of vector stencils for simple construction and design of Pie Charts, Donut Chart, and Pie Graph Worksheets.
- Circle Arrow Png
- Vector Circle Design Png
- 4 Elements Png
- Pink Circle Png
- 4 Arrows Circle Png
- Blue Png Donut Circle
- Research cycle - Circle diagram | Circular diagrams - Vector stencils ...
- Vector Circle Png
- Vicious circle - Crystal diagram | Geo Map - Europe - France ...
- Pie Circle Png
- Diamond Crystal Line Diagram Png
- Water cycle diagram | Research cycle - Circle diagram | Process ...
- 2 Arrow Circle Flow Icon Png
- Circle Donut Png
- Vicious circle - Crystal diagram | Electrical Symbols — Analog and ...
- Aroow Circle Png
- 6 Circles Flow Chart Png
- 2 3 Pie Chart Png
- Crystal Mapping | Virtuous circle (macroeconomics) - Crystal ...
- Marketing Plan Infographic | Internet Marketing Infographic | 3- 4 ...