This site uses cookies. By continuing to browse the ConceptDraw site you are agreeing to our Use of Site Cookies.
HelpDesk

How to Draw a Circular Arrows Diagram

The cyclic recurrence is a fundamental property of multiple systems. The cycle is a process which consists of elements (phases, stages, stages) following each other. Many processes in astronomy, biology, chemistry, physics, mathematics, etc. have a cycle properties. It is also widely used in information technologies and marketing analysis. Graphical representation of cyclic processes can have many forms. It can be a circle, parabola, hyperbola, ellipse, and others. A Circular Arrows Diagram is used as one of the statistical charts in the business, mass media and marketing. ConceptDraw DIAGRAM provides tools for making easy drawing Circular Arrows Diagrams.

Circle Spoke Diagram Template

ConceptDraw DIAGRAM diagramming and vector drawing software offers the Circle Spoke Diagram Template included in the Circle-Spoke Diagrams Solution from the "Diagrams" Area. Use of ready template is the easiest way of drawing professional looking Circle-Spoke Diagrams.
HelpDesk

How to Draw Geometric Shapes

Knowledge of geometry grants people good logic, abstract and spatial thinking skills. The object of study of geometry is the size, shape and position, the 2-dimensional and 3-dimensional shapes. Geometry is related to many other areas in math and is used daily by engineers, architects, designers, and many other professionals. Today, the objects of geometry are not only shapes and solids. It deals with properties and relationships and looks much more about analysis and reasoning. Geometry drawings can be helpful when you study geometry or need to illustrate some investigation related to geometry. ConceptDraw DIAGRAM allows you to draw plane and solid geometry shapes quickly and easily.
HelpDesk

How to Draw Physics Diagrams

Physics charts can be helpful when you learn Physics, perform experiments, or solve any other tasks regarding Physics. ConceptDraw DIAGRAM allows you to draw physical diagrams of mechanical, nuclear, optical and electrical processes using the set of vector physics symbols and physics diagram templates. Nothing is more helpful in the study of physics as a visual representation of the physical processes: physics schemes, diagrams, and illustrations.
HelpDesk

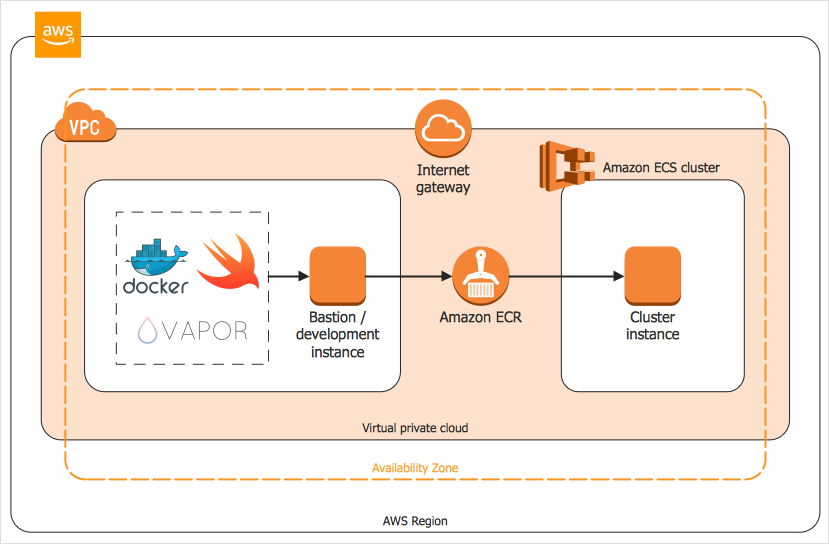
How to Create an AWS Architecture Diagram

Displaying an Amazon Web Service (AWS) cloud actually requires large amounts of attention to detail. Every element of technology has to be addressed: software, middleware, transaction processing, scaling, data storage; the complete list is staggering. Using the ConceptDraw AWS Architecture Diagrams solution makes much easier the work on documenting the Amazon Web Service architecture. The ConceptDraw AWS Architecture Diagrams solution includes icons, sample, and templates for some Amazon Web Services products and resources, to be used when building architecture diagrams. The icons are simple so that user can easily incorporate them in his drawings. AWS Architecture Diagrams can be used in presentations, datasheets, or any other technical visualizations.

Flowchart design. Flowchart symbols, shapes, stencils and icons

A flowchart is a type of diagram that represents an algorithm, workflow or process, showing the steps as boxes of various kinds - flowchart symbols, and their order by connecting them with arrows.
Mavericks have always desired to stand apart and gorgeous design is the recipe for that. Any business graphic document will be more understandable if will use an expository color scheme for their parts. Flowchart design makes versatile presenting and explaining of the process and gives a fresh view that distinguishes it from black and white flowcharts on a paper. Workflow diagram or process flow diagrams become more understandable to ordinary people when it use minimum symbols and special signs.
The best design can be accomplished by starting from any of the suitable Conceptdraw examples. Pick one of them and begin to input proper text into each Flowchart symbols and shapes. Apply less colors in the document and don't turn into rainbow your diagram, three or four will be enough, also note that business process flowchart may not contain bright color hues. The next clue is to use identical colors for same flowchart shape types.
Business Process Modeling with ConceptDraw
Business Process Modeling with ConceptDraw "Business Process Diagrams" Solution

2 Circle Venn Diagram. Venn Diagram Example

Using the ready-to-use predesigned objects, samples and templates from the Venn Diagrams Solution for ConceptDraw DIAGRAM you can create your own professional looking Venn Diagrams quick and easy.

Circle Diagrams

The Circle Diagrams are the diagrams which represent the central element surrounded by other items in a circle. This type of diagram is very popular and widely used in marketing and management, for process modeling, market, resource, time and cost analysis, for visualization causes and effects. If you dream to design the Circle Diagrams quick and easy – the ConceptDraw DIAGRAM software extended with Circle-Spoke Diagrams Solution from the "Diagrams" Area is exactly what you need.

physical security plan, security chart, access chart, security plans, access schemes, access plans , CCTV Security and Access Plans

physical security plan, security chart, access chart, security plans, access schemes, access plans , CCTV
The Security and Access Plans solution may be utilized in order to develop detailed equipment and cabling layout plans, blueprints, and wiring diagrams on internal and external security and access control systems, video surveillance and closed-circuit television (CCTV) systems. IT specialists, security managers, and other guards may use it to quickly design security plans and access plans, security chart, physical security plan, access chart, or access scheme on desire.

Entity Relationship Diagram - ERD - Software for Design Crows Foot ER Diagrams

Crow's Foot notation was proposed by Gordon Everest. According to this notation, the entity is represented by rectangle, relation is depicted by line which ties two entities involved in a relationship. Entity-relationship diagrams based on both Chen's and Crow's Foot notations, can be easily drawn using the ConceptDraw DIAGRAM ERD diagrams software tools for design element Crow's Foot and Chen from Entity-Relationship Diagram (ERD) solution.
How to Build an Entity Relationship Diagram (ERD)