How to Draw Business Process Diagrams with RapidDraw Interface

 Fishbone Diagram
Fishbone Diagrams solution extends ConceptDraw DIAGRAM software with templates, samples and library of vector stencils for drawing the Ishikawa diagrams for cause and effect analysis.
Physics Diagrams

HelpDesk
How to Draw Physics Diagrams

HelpDesk
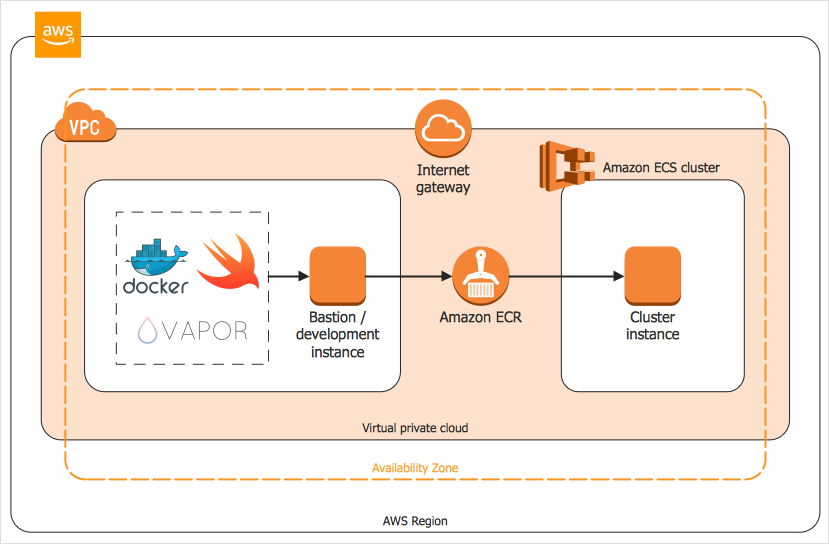
How to Create an AWS Architecture Diagram
Spider Chart Template

 Seating Plans
The Seating Plans solution including samples, seating chart templates and libraries of vector design elements assists in creating the Seating plans, Seating arrangement charts, Chair layout designs, Plan drawings of cinema seating, Movie theater chair plans, extensive Cinema theater plans depicting the seating arrangement in the cinema halls, location of closet, cafe and food sale area, in designing the Seating plans for the large seating areas, Seat plan designs for airplanes, trains, etc. Use any of the included samples as the table seating chart template or seating chart template free and achieve professional drawing results in a few minutes.
 Entity-Relationship Diagram (ERD)
Entity-Relationship Diagram (ERD) solution extends ConceptDraw DIAGRAM software with templates, samples and libraries of vector stencils from drawing the ER-diagrams by Chen's and crow’s foot notations.
 Office Layout Plans
Office layouts and office plans are a special category of building plans and are often an obligatory requirement for precise and correct construction, design and exploitation office premises and business buildings. Designers and architects strive to make office plans and office floor plans simple and accurate, but at the same time unique, elegant, creative, and even extraordinary to easily increase the effectiveness of the work while attracting a large number of clients.
 Aerospace and Transport
This solution extends ConceptDraw DIAGRAM software with templates, samples and library of vector clipart for drawing the Aerospace and Transport Illustrations. It contains clipart of aerospace objects and transportation vehicles, office buildings and anci
 Plant Layout Plans
Plant Layout Plans solution can be used for power plant design and plant layout design, for making the needed building plant plans and plant layouts looking professionally good. Having the newest plant layout software, the plant design solutions and in particular the ConceptDraw’s Plant Layout Plans solution, including the pre-made templates, examples of the plant layout plans, and the stencil libraries with the design elements, the architects, electricians, interior designers, builders, telecommunications managers, plant design engineers, and other technicians can use them to create the professionally looking drawings within only a few minutes.
Network Diagram Software. LAN Network Diagrams. Physical Office Network Diagrams


 Gym and Spa Area Plans
Gym and Spa Area Plans solution extends abilities of the architects, designers, engineers, builders, marketing experts, gym instructors, fitness trainers, health and beauty services specialists. It is a real finding for all them due to the unique functionally thought-out drawing tools, samples and examples, template and libraries of pre-made vector design elements offered to help create the Gym and Spa area plans, Fitness plans, Gym workout plan, Gym layout plan, Spa design plans, Gym floor plan and Spa floor plan with any degree of detailing.
Emergency Plan


- Pie Chart Examples and Templates | Arrow circle chart - Template ...
- Audio, Video, Media | Manufacturing and Maintenance | Illustrator ...
- How to Draw an Organization Chart | Examples of Flowcharts, Org ...
- Triangular Graph Template
- Graph Illustrator
- Fishbone Diagram Illustrator
- Create Beautiful Charts Illustrator
- Illustrator Network Diagram Symbols
- Time Series Dashboard | Design elements - Time series charts ...
- Illustrator Graph Design
- How to Make a Timeline | Timeline Examples | Project Timeline ...
- Pie Chart Infographic Illustrator
- Basic Flowchart Symbols and Meaning | Venn Diagram Examples ...
- Weekly Chore Chart Template
- How To Make Chart Bar In Illustrator
- Process Flowchart | Functional Block Diagram | Block Diagram | The ...
- Illustrator Free Download
- Process Flowchart | Basic Flowchart Symbols and Meaning ...
- Circular Arrows Diagrams | How to Draw a Circular Arrows Diagram ...
- Adobe Illustrator Process Diagram Graphics