The vector stencils library "ERD, Chen's notation" contains 13 ERD elements.
Use it for drawing ER-diagrams using Chen's notation in the ConceptDraw PRO diagramming and vector drawing software extended with the Entity-Relationship Diagram (ERD) solution from the Software Development area of ConceptDraw Solution Park.
Use it for drawing ER-diagrams using Chen's notation in the ConceptDraw PRO diagramming and vector drawing software extended with the Entity-Relationship Diagram (ERD) solution from the Software Development area of ConceptDraw Solution Park.
Entity

Weak entity

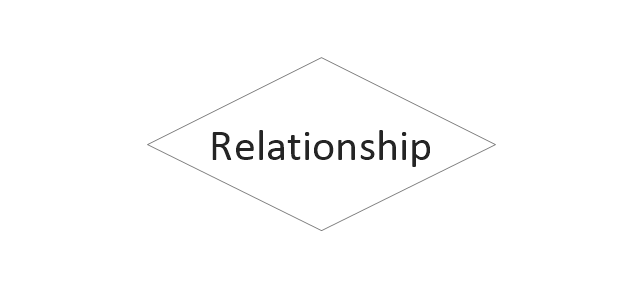
Relationship
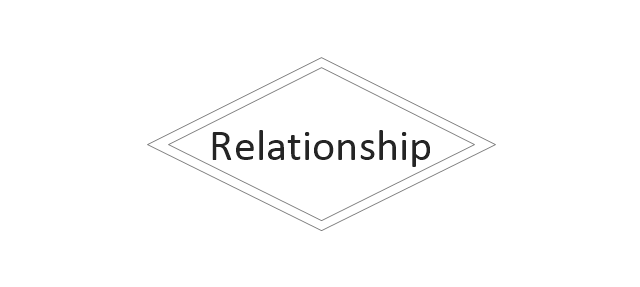
Identifying Relationship
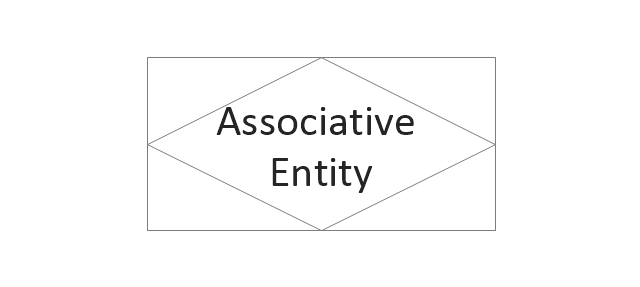
Associative Entity
Participation

Optional participation
Recursive Relationship
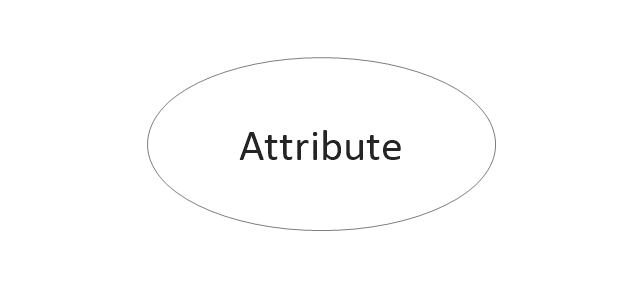
Attribute
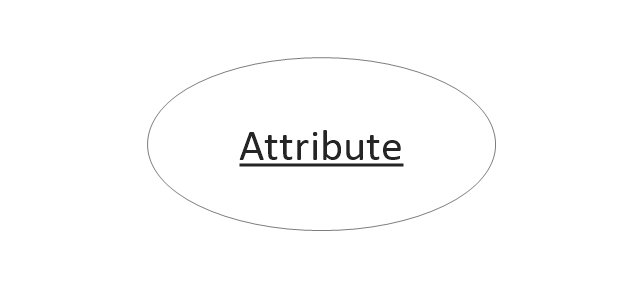
Key attribute
Weak key attribute

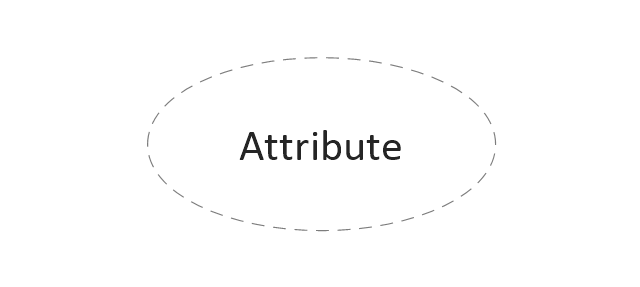
Derived attribute
Multivalue attribute
ERD Symbols and Meanings


The vector stencils library "ERD, Chen's notation" contains 13 ERD elements.
Use it for drawing ER-diagrams using Chen's notation in the ConceptDraw PRO diagramming and vector drawing software extended with the Entity-Relationship Diagram (ERD) solution from the Software Development area of ConceptDraw Solution Park.
Use it for drawing ER-diagrams using Chen's notation in the ConceptDraw PRO diagramming and vector drawing software extended with the Entity-Relationship Diagram (ERD) solution from the Software Development area of ConceptDraw Solution Park.
Entity
Weak entity
Relationship
Identifying Relationship
Associative Entity
Participation
Optional participation
Recursive Relationship
Attribute
Key attribute
Weak key attribute
Derived attribute
Multivalue attribute
ConceptDraw DIAGRAM ER Diagram Tool

"Chen's notation for entity–relationship modeling uses rectangles to represent entity sets, and diamonds to represent relationships appropriate for first-class objects: they can have attributes and relationships of their own. If an entity set participates in a relationship set, they are connected with a line.
Attributes are drawn as ovals and are connected with a line to exactly one entity or relationship set.
Cardinality constraints are expressed as follows:
- a double line indicates a participation constraint, totality or surjectivity: all entities in the entity set must participate in at least one relationship in the relationship set;
- an arrow from entity set to relationship set indicates a key constraint, i.e. injectivity: each entity of the entity set can participate in at most one relationship in the relationship set;
- a thick line indicates both, i.e. bijectivity: each entity in the entity set is involved in exactly one relationship.
- an underlined name of an attribute indicates that it is a key: two different entities or relationships with this attribute always have different values for this attribute.
Attributes are often omitted as they can clutter up a diagram; other diagram techniques often list entity attributes within the rectangles drawn for entity sets." [Entity–relationship model. Wikipedia]
The vector stencils library ERD, Chen's notation contains 13 symbols for drawing entity-relatinship diagrams using the ConceptDraw PRO diagramming and vector drawing software.
The example "Design elements - ER diagram (Chen notation)" is included in the Chen Notation solution from the Software Development area of ConceptDraw Solution Park.
Chen's ERD
.png--diagram-flowchart-example.png)
Entity Relationship Diagram Examples

Data modeling with ConceptDraw DIAGRAM

Components of ER Diagram

ConceptDraw DIAGRAM ER Diagram Tool
Entity-Relationship Diagram (ERD) with ConceptDraw DIAGRAM

- Chen Notation | Design elements - ER diagram ( Chen notation ...
- ERD, Chen's notation - Vector stencils library | Design elements - ER ...
- ERD, Chen's notation - Vector stencils library | ERD, Chen's notation ...
- Er Diagram Optional Attribute
- Entity Relationship Diagram Symbols | ERD Symbols and Meanings ...
- Visio Files and ConceptDraw | Meaning Of Weak Key Attribute
- UML Class Diagram Notation | Design elements - ERD (crow's foot ...
- Design elements - ER diagram ( Chen notation ) | Chen Notation ...
- ERD, Chen's notation - Vector stencils library