Process Flowchart


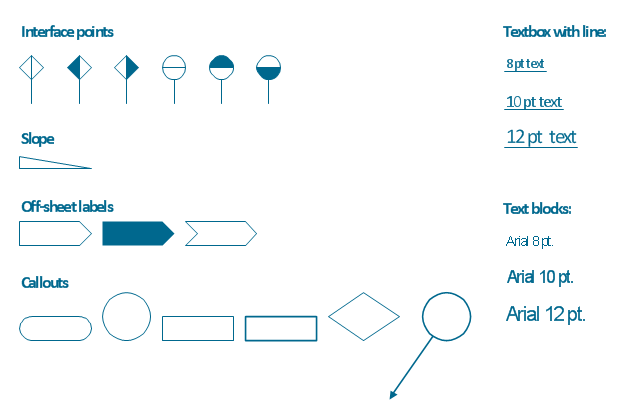
The vector stencils library "Process annotations" contains 22 symbols of interface points, slope, off-sheet labels, callouts and textboxes.
Use these shapes for setting automatic labels to display a datasheet field for a pipeline shape, labels, captions, outlines, off-sheet labels, text balloons, annotations, outlines, tags, and descriptions.
"In engineering a process is a set of interrelated tasks that, together, transform inputs into outputs. These tasks may be carried out by people, nature, or machines using resources; so an engineering process must be considered in the context of the agents carrying out the tasks, and the resource attributes involved. Systems Engineering normative documents and those related to Maturity Models are typically based on processes. For example, System Engineering processes of the EIA-632 and processes involved in the Capability Maturity Model Integration (CMMI) institutionalization and improvement approach. Constraints imposed on the tasks and resources required to implement them are essential for executing the tasks mentioned.
A chemical process is a series of unit operations used to produce a material in large quantities.
In the chemical industry, chemical engineers will use the following to define or illustrate a process:
Process Flow Diagram (PFD),
Piping and instrumentation diagram
(P&ID),
Simplified process description,
Detailed process description,
Project management,
Process simulation." [Process (engineering). Wikipedia]
The example "Design elements - Process annotations" was created using the ConceptDraw PRO diagramming and vector drawing software extended with the Chemical and Process Engineering solution from the Engineering area of ConceptDraw Solution Park.
Process annotation symbols
Process Flow Diagram

Basic Flowchart Symbols and Meaning


Process Diagrams

Types of Flowcharts


Technical Drawing Software

Mechanical Engineering

Electrical Symbols, Electrical Diagram Symbols

Cross-Functional Flowchart


Cross-Functional Flowchart (Swim Lanes)

Star Network Topology


 Cross-Functional Flowcharts
Cross-functional flowcharts are powerful and useful tool for visualizing and analyzing complex business processes which requires involvement of multiple people, teams or even departments. They let clearly represent a sequence of the process steps, the order of operations, relationships between processes and responsible functional units (such as departments or positions).
 Sales Flowcharts
The Sales Flowcharts solution lets you create and display sales process maps, sales process workflows, sales steps, the sales process, and anything else involving sales process management.
 Event-driven Process Chain Diagrams
Event-driven Process Chain (EPC) Diagram is a type of flowchart widely used for modeling in business engineering and reengineering, business process improvement, and analysis. EPC method was developed within the Architecture of Integrated Information Systems (ARIS) framework.
- Process Flowchart | Heat Transfer Unit Operations Symbols
- Types Of Unit Operation In Chemical Engineering Process Diagram
- Unit Operation Symbol
- Unit Operations Symbols On Engineering Drawing
- Examples Of Unit Operations And Their Chemical Engineering
- Process Flowchart | Cooler Symbol Of Unit Operation
- Chemical Engineering | Chemical and Process Engineering ...
- Petrochemical Unit Operation Process
- How To Draw Bfd For Unit Operations
- Example Of Chemical Engineering Including All Unit Operations
- Types Of Unit Operation In Chemical Engineering
- Unit Operation Chemical Engineering Icon
- Symbol Of Unit Operation
- Unit Operation Symbols
- Www Different Symbols Of Unit Operations And Its Use
- Task And Solution For Chemical Unit Operations
- Chemical Engineering Symbols
- Symbol For Various Unit Operation
- Unit Operations Symbols