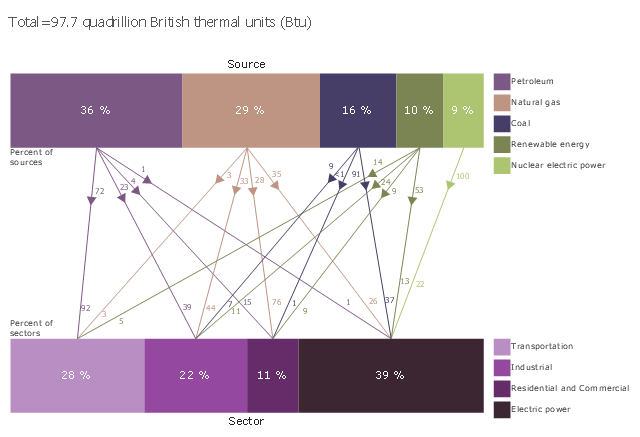
This divided bar diagram sample shows U.S. primary energy consumption by source and sector in 2015. It was designed using data from the chart in the webpage "U.S. Energy Facts Explained, Consumption & Production" on the website of the U.S. Energy Information Administration.
"Americans use many types of energy
Petroleum, natural gas, coal, renewable energy, and nuclear electric power are primary sources of energy. Electricity is a secondary energy source that is generated from primary sources of energy.
Energy sources are measured in different physical units: liquid fuels in barrels or gallons, natural gas in cubic feet, coal in short tons, and electricity in kilowatts and kilowatthours. In the United States, British thermal units (Btu), a measure of heat energy, is commonly used for comparing different types of energy to each other. In 2015, total U.S. primary energy consumption was about 97.7 quadrillion (1015, or one thousand trillion) Btu."
[eia.gov/ energyexplained/ index.cfm?page=us_ energy_ home]
The chart example "U.S. primary energy consumption by source and sector" was created using the ConceptDraw PRO diagramming and vector drawing software extended with the Divided Bar Diagrams solution from the Graphs and Charts area of ConceptDraw Solution Park.
Divided bar chart
Energy Pyramid Diagram

 Pie Charts
Pie Charts are extensively used in statistics and business for explaining data and work results, in mass media for comparison (i.e. to visualize the percentage for the parts of one total), and in many other fields. The Pie Charts solution for ConceptDraw PRO v10 offers powerful drawing tools, varied templates, samples, and a library of vector stencils for simple construction and design of Pie Charts, Donut Chart, and Pie Graph Worksheets.
Flow chart Example. Warehouse Flowchart


Chart Examples

Electrical Symbols — Power Sources

 Manufacturing and Maintenance
Manufacturing and maintenance solution extends ConceptDraw PRO software with illustration samples, templates and vector stencils libraries with clip art of packaging systems, industrial vehicles, tools, resources and energy.
 Divided Bar Diagrams
The Divided Bar Diagrams Solution extends the capabilities of ConceptDraw PRO v10 with templates, samples, and a library of vector stencils for drawing high impact and professional Divided Bar Diagrams and Graphs, Bar Diagram Math, and Stacked Graph.
 Sales Flowcharts
The Sales Flowcharts solution lets you create and display sales process maps, sales process workflows, sales steps, the sales process, and anything else involving sales process management.
Types of Flowcharts


Competitor Analysis

 Picture Graphs
Typically, a Picture Graph has very broad usage. They many times used successfully in marketing, management, and manufacturing. The Picture Graphs Solution extends the capabilities of ConceptDraw PRO v10 with templates, samples, and a library of professionally developed vector stencils for designing Picture Graphs.
 25 Typical Orgcharts
The 25 Typical Orgcharts solution contains powerful organizational structure and organizational management drawing tools, a variety of professionally designed organization chart and matrix organization structure samples, 25 templates based on various orga
Scatter Chart Examples

Technical Flow Chart Example

- Source Of Energy Mathematics Pie Chart
- Chart On Renewable And Nonrenewable Sources Of Energy
- Flow Chart Of Renewable And Nonrenewable Sources Of Energy
- Energy Pyramid Diagram | Energy resources diagram | Resources ...
- Histogram For Sources Of Energy
- A Pictorial Chart Of Renewable Source Of Energy
- Draw The Chart Of Classification Of Various Energy Sources
- Renewable Energy Source Charts Diagrams
- Renewable energy | Pie Charts | Divided Bar Diagrams | Example Of ...
- Drawing Charts Onrenewable Energy Sources Drawing Charts On It
- Electrical Symbols — Power Sources | Pie Charts | Energy Pyramid ...
- Flow Chart On Source Of Energy
- Pie Charts | Energy resources diagram | Manufacturing and ...
- Energy resources diagram | Pie Charts | Manufacturing and ...
- Drawings And Diagrams For Conventional Sources Of Energy
- Electrical Symbols — Power Sources | Energy resources diagram ...
- U.S. primary energy consumption by source and sector | Flow chart ...
- Manufacturing and Maintenance | Pie Charts | Flow chart Example ...
- Examples Of Energy Sources
- Draw Renewable Sources Of Energy