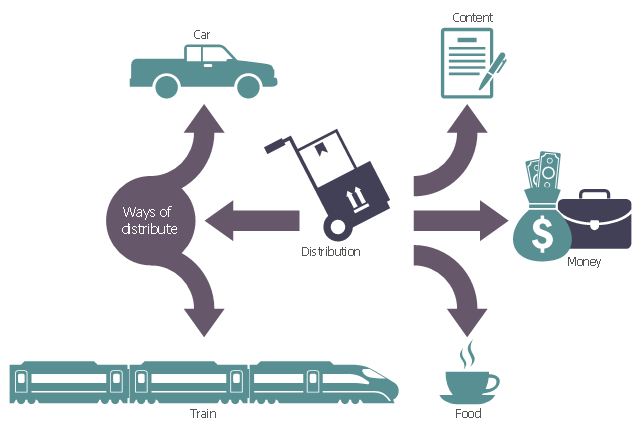
This logistic flow chart sample illustrates the distribution as economics term.
It was designed on the base of the Wikimedia Commons file: 46v1 New-Sheet.jpg.
[commons.wikimedia.org/ wiki/ File:46v1_ New-Sheet.jpg]
"Distribution in economics refers to the way total output, income, or wealth is distributed among individuals or among the factors of production (such as labour, land, and capital). In general theory and the national income and product accounts, each unit of output corresponds to a unit of income. One use of national accounts is for classifying factor incomes and measuring their respective shares, as in National Income. But, where focus is on income of persons or households, adjustments to the national accounts or other data sources are frequently used. Here, interest is often on the fraction of income going to the top (or bottom) x percent of households, the next y percent, and so forth (say in quintiles), and on the factors that might affect them (globalization, tax policy, technology, etc.)." [Distribution (economics). Wikipedia]
The logistic flowchart example "Distribution mind map" was created using ConceptDraw PRO diagramming and vector drawing software extended with the Logistics Flow Charts solution from the Business Processes area of ConceptDraw Solution Park.
Logistic flowchart
 Pie Charts
Pie Charts are extensively used in statistics and business for explaining data and work results, in mass media for comparison (i.e. to visualize the percentage for the parts of one total), and in many other fields. The Pie Charts solution for ConceptDraw PRO v10 offers powerful drawing tools, varied templates, samples, and a library of vector stencils for simple construction and design of Pie Charts, Donut Chart, and Pie Graph Worksheets.
This flowchart example was created on the base of land sales process diagram from the Property management webpage of the VicRoads website.
[www.vicroads.vic.gov.au/ planning-and-projects/ property-services/ property-management]
"VicRoads or the Roads Corporation of Victoria is a statutory corporation which is the state road and traffic authority in the state of Victoria, Australia. It is responsible for maintenance and construction of the state arterial road network, as well as driver licensing and vehicle registration. VicRoads has broad responsibility for road safety policy and research. It is also responsible for regulating the accident towing industry in Victoria." [VicRoads. Wikipedia]
"Sales Process.
Once it has been established with the relevant VicRoads Regions/ Projects and other business areas that properties are identified as surplus to VicRoads’ operational needs, they are incorporated in the VicRoads annual sales program.
Following approval: relevant VicRoads Regional Manager and the VicRoads Chief Executive (and in some circumstances Minster for Public Transport and Roads) must approve all land deemed surplus and available for disposal.
The method of sale is then determined and consultant advice is sought:
(1) Planning.
(2) Valuer General Victoria (Valuer General’s office must provide a valuation for all sales).
(3) Government Land Monitor (Land Monitor approval is sought if the value exceeds $750,000).
(4) Environmental.
(5) Local Council." [www.vicroads.vic.gov.au/ planning-and-projects/ property-services/ property-management]
The example "Land sales process flowchart" was created using the ConceptDraw PRO diagramming and vector drawing software extended with the Sales Flowcharts solution from the Marketing area of ConceptDraw Solution Park.
Sales process chart

Work Order Process Flowchart. Business Process Mapping Examples

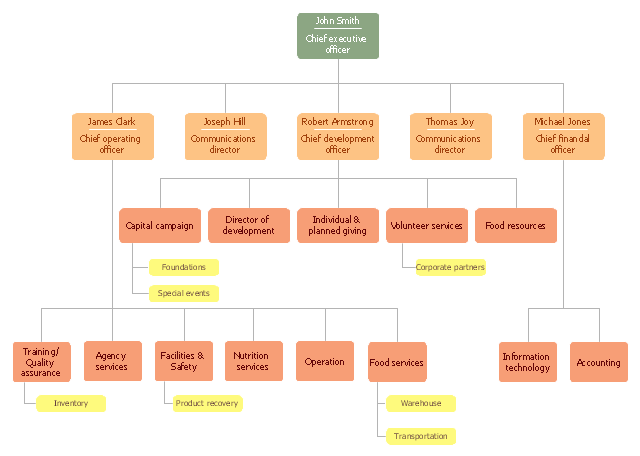
"A food bank or foodbank is a non-profit, charitable organization that distributes food to those who have difficulty purchasing enough food to avoid hunger.
In the United States and Australia, food banks usually operate on the "warehouse" model. They act as food storage and distribution depots for smaller front line agencies; and usually do not themselves give out food directly to the hungry. After the food is collected, sorted, and reviewed for quality, these food banks distribute it to non-profit community or government agencies, including food pantries, food closets, soup kitchens, homeless shelters, orphanages, and schools.
Outside North America and Australia, the "front line" model is often found. Such food banks give out most or all of their food directly to the end users. For both models, the largest sources of food include for-profit growers, manufacturers, distributors and retailers who in the normal course of business have excess food that they cannot sell. Some foodbanks receive a substantial proportion of their food from individual donors, including their volunteer workers. There is considerable overlap with food salvage, food rescue and gleaning, although not with freeganism or dumpster-diving." [Food bank. Wikipedia]
The organization chart example "Foodbank" was created using the ConceptDraw PRO diagramming and vector drawing software extended with the Organizational Charts solution from the Management area of ConceptDraw Solution Park.
Organizational chart
 UK Map
The Map of UK solution contains collection of professionally designed samples and scalable vector stencil graphics maps, representing the United Kingdom counties, regions and cities. Use the Map of UK solution from ConceptDraw Solution Park as the base fo
 USA Maps
Use the USA Maps solution to create a map of USA, a US interstate map, printable US maps, US maps with cities and US maps with capitals. Create a complete USA states map.
 HR Flowcharts
Human resource management diagrams show recruitment models, the hiring process and human resource development of human resources.
Types of Flowchart - Overview


 Sales Flowcharts
The Sales Flowcharts solution lets you create and display sales process maps, sales process workflows, sales steps, the sales process, and anything else involving sales process management.
 Wireless Networks
The Wireless Networks Solution extends ConceptDraw PRO software with professional diagramming tools, set of wireless network diagram templates and samples, comprehensive library of wireless communications and WLAN objects to help network engineers and designers efficiently design and create Wireless network diagrams that illustrate wireless networks of any speed and complexity, and help to identify all required equipment for construction and updating wireless networks, and calculating their costs.
How to Create Presentation of Your Project Gantt Chart

Sales Steps

Business Diagram Software


 Landscape & Garden
The Landscape and Gardens solution for ConceptDraw PRO v10 is the ideal drawing tool when creating landscape plans. Any gardener wondering how to design a garden can find the most effective way with Landscape and Gardens solution.
- Sales Distribution Flow Chart
- Sales Process Flow Chart
- Flow Chart Distribution Process
- Charts Of Different Occupation In Society
- Flow chart Example. Warehouse Flowchart | Draw A Chat Of Sale ...
- Distribution mind map | Distribution mind map | Rail transport ...
- Sales And Distribution Flow Chart
- Flow Chart On State Government
- Sales And Distribution Process Flow
- Simple Flow Chart | Land sales process flowchart | Process ...
- Sales Process Flowchart. Flowchart Examples | Land sales process ...
- Organization chart - Foodbank | Examples of Flowcharts , Org Charts ...
- Supermarket parking - Site plan | Organization chart - Foodbank ...
- Flow Chart In Operation Research
- Organization chart - Foodbank | Organizational Charts | Create ...
- Man Type Flow Charts
- Ownership Chart
- Pictures of Graphs | Population growth by continent | Line Graph ...
- Flow chart Example. Warehouse Flowchart | Workflow diagrams ...
- Land sales process flowchart | Value stream with ConceptDraw PRO ...