Flowchart Example: Flow Chart of Marketing Analysis
An example flowchart of marketing analysis shows main steps you have to challenge writing a marketing analysis.Customer Relationship Management
Customer relationship management is an important component of sales success. Visualizing sales data you may put some KPI related to customers relationship management to your Sales dashboard and track this important aspect in real time.
 Correlation Dashboard
Correlation dashboard solution extends ConceptDraw PRO software with samples, templates and vector stencils library with Scatter Plot Charts for drawing the visual dashboard visualizing data correlation.
 Status Dashboard
Status dashboard solution extends ConceptDraw PRO software with templates, samples and vector stencils libraries with graphic indicators for drawing the visual dashboards showing status data.
What Constitutes a Project?
Separated into categories of Basic, Intermediate, and Advanced categories, the new instructional videos about ConceptDraw PROJECT cover a huge breadth of topics, explaining how to use project management software. Users new to ConceptDraw PROJECT will find the Basic lessons an essential platform for familiarizing themselves with the programs′s functions and found it simple project management software. This video lesson is the first in Basic lessons series tells about affordable simple project management software, it may be used as an intro for what is project management using simple project management sample. ConceptDraw PROJECT is excellent portfolio project management software, this lessons explains how to use project management software for small business in case of multi project environment.
 What is a Dashboard Area
Solutions from the area What is a Dashboard of ConceptDraw Solution Park collects templates, samples and vector stencils libraries with of data driven charts and indicators for drawing the basic types of Visual Dashboards.
 PM Dashboards
This solution extends ConceptDraw PRO and ConceptDraw PROJECT software with the ability to clearly display the identified key performance indicators for any project.
Project —Task Trees and Dependencies
Users new to ConceptDraw PROJECT will find the Basic lessons an essential platform for familiarizing themselves with the program′s functions. This video lesson will teach you how to set up task trees and dependencies.BCG Matrix
The growth–share matrix (BCG Matrix) was created by Bruce D. Henderson for the Boston Consulting Group in 1970 to help corporations to analyze their business units and to help the company allocate resources. How is it easy design the BCG Matrices in ConceptDraw PRO diagramming and vector drawing software supplied with unique Matrices Solution from the Marketing Area of ConceptDraw Solution Park.HelpDesk
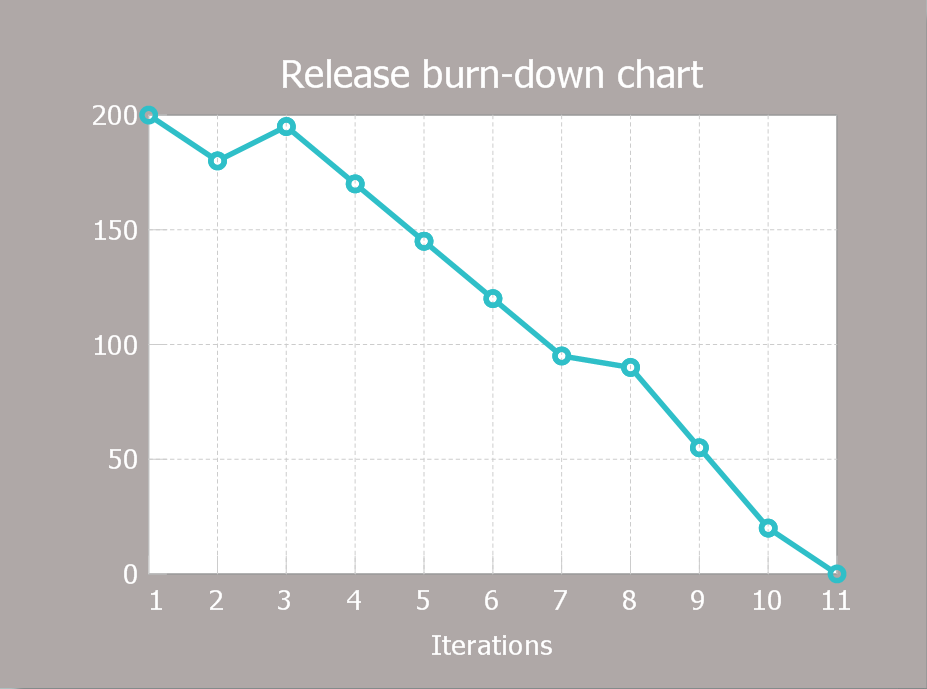
How to Create a Release Burn-Down Chart Using ConceptDraw PRO
The Agile methodology provides project teams the ability to quickly adapt the project to the current situation and thus achieve maximum productivity. According the Scrum method the steps needed to fulfill the project goal breaks down by using short sprints or iterations. The iterations together with an extensive collaboration can increase productivity by better understanding the entire flow of a project. A release burn-down chart is used to track a progress on a Scrum project. The ConceptDraw Scrum Workflow Solution makes it easy for Agile project team to build any professional Scrum diagram such as a Release velocity chart, Release burn-down chart, Sprint burn-down chart, or a Team velocity chart.Construction Project Chart Examples
ConceptDraw PROJECT provides a set of construction Gantt chart examples. Project manager requires task tracking, and project examples best approach to start. Make your project applying one of our ready-made examples.
 Sales Flowcharts
The Sales Flowcharts solution lets you create and display sales process maps, sales process workflows, sales steps, the sales process, and anything else involving sales process management.
Create Response Charts
Visual navigation through the stages of a response process helps you locate specific actions to be taken via Action Mind Maps. Use ConceptDraw PRO and ConceptDraw MINDMAP for organize the process of response for interactions occurring in social media.How to Report Task's Execution with Gantt Chart
ConceptDraw PROJECT’s powerful reporting engine lets you generate a set of tabular reports with just one click, or visualize your project as Radial Tasks Structures, Work Breakdown Structures and Resource Calendars. It also provides you with dynamic Project Dashboards.- Gauges Chart Software
- Sales Process Flowchart. Flowchart Examples | Sales Flowcharts ...
- Pie Chart Marketing Mix Products
- Reporting Dashboard Software for Business | Sales Teams are ...
- Sales Process Flowcharts | Bar Chart Template for Word | Sales ...
- Percentage Pie Chart . Pie Chart Examples | TQM Diagram Example ...
- Gauges Chart Howto
- Status Dashboard | How To Create Project Report | Construction ...
- Design elements - Sales KPIs and metrics | Sales Teams are ...
- KPI Dashboard | What is a KPI? | A KPI Dashboard Provides the ...
- Gauge Chart Templates
- Marketing and Sales Organization chart . Organization chart Example
- Charts And Dashboard For Sales
- KPI Dashboard | Sales Teams are Inherently Competitive | Sales ...
- Organizational Charts | How to Use ConceptDraw Sales Dashboard ...
- Performance Indicators | PM Dashboards | Design elements - Sales ...
- Performance Indicators | KPI Dashboard | What is a KPI? | Key ...
- London election results | What is a Dashboard Area | Design ...
- What is a KPI? | KPI Dashboard | Performance Indicators | Kpi ...
- Sales performance dashboard | Design elements - Sales KPIs and ...


