HelpDesk
How to Add a Telecommunication Network Diagram to a PowerPoint Presentation

Stakeholder Onion Diagram Template

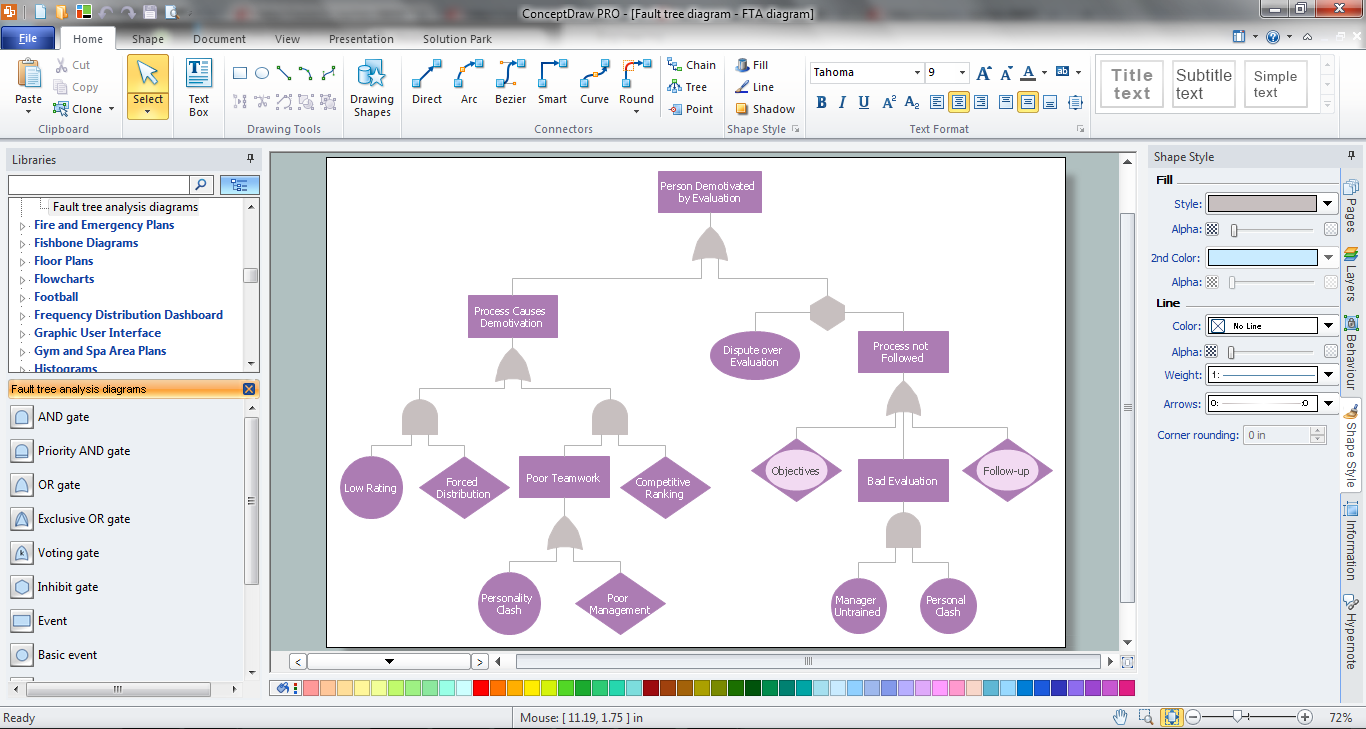
Fault Tree Analysis Software
Data Flow Diagram

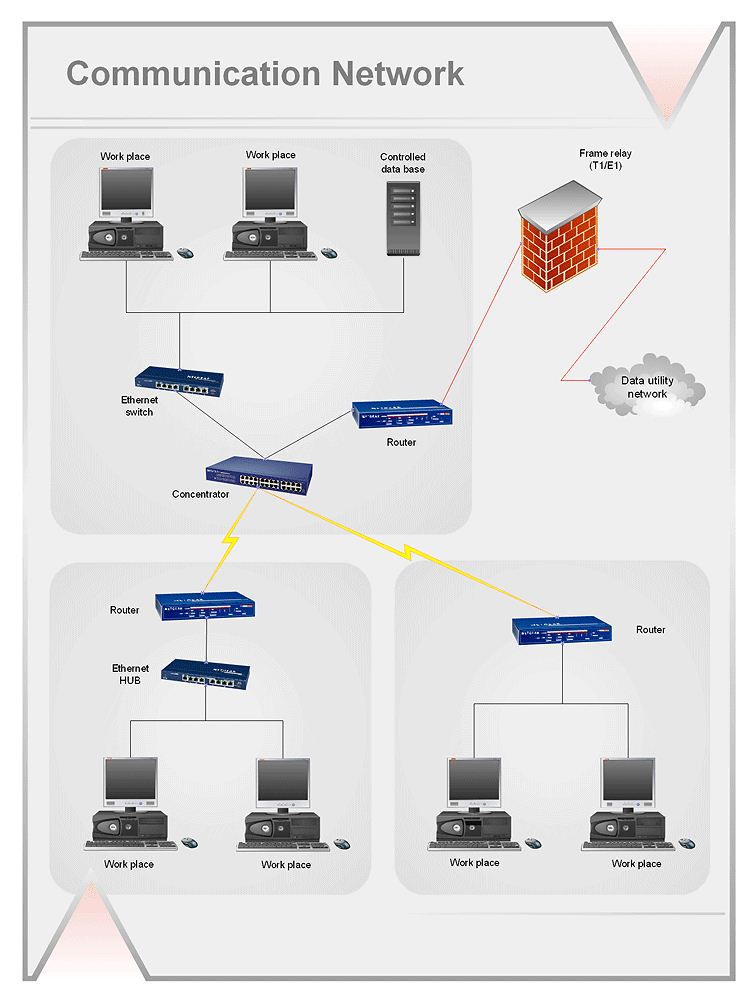
 Computer Network Diagrams
Computer Network Diagrams solution extends ConceptDraw DIAGRAM software with samples, templates and libraries of vector icons and objects of computer network devices and network components to help you create professional-looking Computer Network Diagrams, to plan simple home networks and complex computer network configurations for large buildings, to represent their schemes in a comprehensible graphical view, to document computer networks configurations, to depict the interactions between network's components, the used protocols and topologies, to represent physical and logical network structures, to compare visually different topologies and to depict their combinations, to represent in details the network structure with help of schemes, to study and analyze the network configurations, to communicate effectively to engineers, stakeholders and end-users, to track network working and troubleshoot, if necessary.
 Artwork
Artwork solution extends ConceptDraw DIAGRAM software with illustration samples, templates and libraries of vector clipart of architecture, food, music, funny animals, aquatic fauna and transport.
Pie Chart Examples and Templates

Flowchart Software


Organizational Chart Templates


Network Diagramming with ConceptDraw DIAGRAM
- Wide Area Network Smart Art Diagram
- Relationship Diagrams Smart Art
- Org Chart Smart Art
- Office Smartart Organization Chart Download
- Smartart Examples Of Flowcharts
- Smartart Organization Chart Word
- Smartart Flowchart Example
- Flowcharts | Add Split Decision To Word Flowchart Smart Art Word ...
- Use Of Smartart Graphics And Images To Illustrate A Pan Personal
- Illustration Of A Personal Area Network By Using Smart Art Graphics