This work flow chart sample was redesigned from the picture "Simulation for earthquake disaster assessment" from the article "Simulation Workflows".
[iaas.uni-stuttgart.de/ forschung/ projects/ simtech/ sim-workflows.php]
" This simulation was developed to have an in depth understanding of the destructions and the decisions to be made in various phases of crisis management (Source: Mahdi Hashemi and Ali A. Alesheikh (2010). "Developing an agent based simulation model for earthquakes in the context of SDI." GSDI 12 World Conference. 19 – 22 October 2010. Singapour). The simulation process contains following major steps:
(1) All spatial information including satellite images (before and after the earthquake) and topographic/ cadastral maps of the area are mosaicked and georeferenced. The parts of the city that contain various levels of destructions are selected. Three types of features namely buildings, roads and recreational areas are classified and extracted from the satellite images.
(2) The governing factors of destructions are identified; a mathematical model that integrates the factors is constructed.
(3) The simulation is constructed for various parameter values (different earthquake strength, time elapses, etc.)" [iaas.uni-stuttgart.de/ forschung/ projects/ simtech/ sim-workflows.php]
The example "Workflow diagram - Earthquake disaster assessment" was drawn using the ConceptDraw PRO diagramming and vector drawing software extended with the Workflow Diagrams solution from the Business Processes area of ConceptDraw Solution Park.
Work flow chart

This arrow ring chart sample was created on the base of the figure illustrating the webpage "National Preparedness Cycle. Plan" from the Federal Emergency Management Agency (FEMA) website. "Planning makes it possible to manage the entire life cycle of a potential crisis. Strategic and operational planning establishes priorities, identifies expected levels of performance and capability requirements, provides the standard for assessing capabilities and helps stakeholders learn their roles. The planning elements identify what an organization’s Standard Operating Procedures (SOPs) or Emergency Operations Plans (EOPs) should include for ensuring that contingencies are in place for delivering the capability during a large-scale disaster." [fema.gov/ plan]
The arrow ring chart example "National Preparedness Cycle" was created using the ConceptDraw PRO diagramming and vector drawing software extended with the Target and Circular Diagrams solution from the Marketing area of ConceptDraw Solution Park.
www.conceptdraw.com/ solution-park/ marketing-target-and-circular-diagrams
Arrow ring chart
Beautiful Nature Scene: Drawing

Emergency Plan


Types of Flowchart - Overview


How To Create Emergency Plans and Fire Evacuation

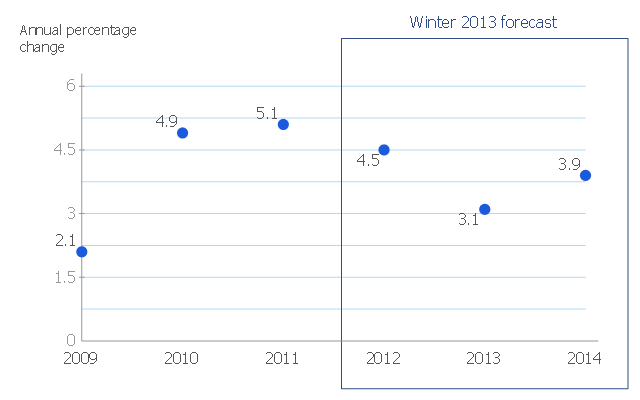
This scatter chart sample shows the MENA's (Middle East and North Africa's) real GDP growth. It was designed on the base scatter graph from the website of the European Economic Forecast (EUROPEAN ECONOMY 1|2013, Economic and Financial Affairs Winter 2013, European Commission). [ec.europa.eu/ economy_ finance/ publications/ european_ economy/ 2013/ pdf/ ee1_ en.pdf]
"The term MENA, for "Middle East and North Africa", is an acronym often used in academic, military planning, disaster relief, and business writing.
Due to the geographic ambiguity and Eurocentric nature of the term "Middle East", many people prefer use of the term WANA (West Asia and North Africa) or the less common NAWA (North Africa-West Asia).
The term covers an extensive region, extending from Morocco to Iran, including the majority of both the Middle Eastern and Maghreb countries. The term is roughly synonymous with the term the Greater Middle East. ...
MENA has no standardized definition; different organizations define the region as consisting of different territories. The following is a list of commonly included countries and territories: Bahrain, Egypt, Iran, Iraq, Israel, Jordan, Kuwait, Lebanon, Yemen, United Arab Emirates, Libya, Morocco, Oman, West Bank and Gaza, Qatar, Saudi Arabia, Syria, Tunisia, Algeria.
Sometimes also included in broader definitions: Armenia, Azerbaijan, Cyprus, Djibouti, Mauritania, Somalia, Sudan, Turkey, Western Sahara." [MENA. Wikipedia]
The scatter chart example "Middle East and North Africa's real GDP growth" was created using the ConceptDraw PRO diagramming and vector drawing software extended with the Line Graphs solution from the Graphs and Charts area of ConceptDraw Solution Park.
Scatter graph
Tools to Create Your Own Infographics

How to Draw a Good Diagram of a Business Workflow?

Best Value Stream Mapping mac Software
 diagram")
Family Emergency Plan

This wheel diagram sample illustrates the emergency preparedness training and exercise processes. It was designed on the base of the diagram on the webpage "Public Health Preparedness Training and Exercise" from the FloridaHealth website of the Florida Department of Health. [floridahealth.gov/ programs-and-services/ emergency-preparedness-and-response/ training-exercise/ ]
"Emergency Preparedness is the discipline of dealing with and avoiding both natural and manmade disasters. It involves mitigation, preparedness, response and recovery in order to lessen the impact of disasters. Emergency management requires a partnership among all levels of government (local, State, and Federal) and the private sector (business and industry, voluntary organizations, and the public). Successful preparedness requires detailed planning and cooperation among each sector." [Emergency Preparedness. Wikipedia]
The arrow donut chart example "Training and exercise process wheel" was created using the ConceptDraw PRO diagramming and vector drawing software extended with the Circular Arrows Diagrams solution from the area "What is a Diagram" of ConceptDraw Solution Park.
Circular arrows diagram

Used Solutions
Restaurant Floor Plans

- Charts On Disaster Management Pie Chart By Diagram
- Disaster Management Pie Chart And Bar Graph For Maths
- Charts On Disaster Management
- Chart Of Disaster Management
- Flow Chart Earthquake Disaster
- Impacts Of Disaster Flow Chart Image
- Pie Chart Natural Disaster In Mathematics
- Flow Charts On Disaster
- Chart Drawing In Disaster Management
- Mathematics | Pie Charts | Venn Diagrams | Disaster Management ...
- Earthquake disaster assessment - Workflow diagram | Emergency ...
- Types of Flowchart - Overview | Earthquake disaster assessment ...
- Disaster Management Cycle Draw A Flowchart And Describe It
- National Preparedness Cycle - Arrow ring chart | Disaster ...
- How Disaster Charts Is Being Drawn
- Flow Chart And Pie Chart Of Disaster Management
- Process Flowchart | Earthquake disaster assessment - Workflow ...
- Flow Chart Of Disaster S
- Pie Chart On Disaster Management
- Draw A Flowchart For Disaster Management Cycle