This site uses cookies. By continuing to browse the ConceptDraw site you are agreeing to our Use of Site Cookies.

How to Draw Business Process Diagrams with RapidDraw Interface

Business Process Modeling Notation (BPMN) is a set of standard symbols that allow you to create a graphical view of a business process. The symbols were developed to help users develop standard, unified structure of processes, and any messages shared between these processes.

Export from ConceptDraw DIAGRAM Document to a Graphic File

Now it’s easy to share your visual documents with other people in a form most convenient for them.
ConceptDraw DIAGRAM can save your drawings and diagrams in a number of highly useful formats, including graphic files. You can save your drawing as a.PNG,.JPG, or other graphic format file.
Export to a Graphic File

Business Report Pie. Pie Chart Examples

This sample shows the Business Report Pie Chart. The Pie Chart visualizes the data as the proportional parts of a whole, illustrates the numerical proportion. Pie Charts are very useful in the business, statistics, analytics, mass media.

Financial Trade UML Use Case Diagram Example

This sample represents the actors, use cases and dependencies between them, and also the relationships between use cases. There are used dependency and use case generalization associations on this UML diagram. Use case generalization is used when you have two similar use cases, but one of them does more than another.
This sample shows the work of the Financial Trade sphere and can be used by trading companies, commercial organizations, traders, different exchanges.

UML Activity Diagram

UML Activity Diagram illustrates the business and operational step-by-step workflows of components in a system and shows the overall flow of control. You can use the appropriate stencils of UML notation from UML Activity library with 37 objects. ConceptDraw is ideal for software designers and software developers who need to draw UML Activity Diagrams.
Use ConceptDraw DIAGRAM diagramming and vector drawing software enhanced with Rapid UML solution from ConceptDraw Solution Park to create your own UML activity diagrams that show the business and operational workflows of components and overall flow of control in your systems. Such software provides coloring UML diagrams for various purposes and simplifying work of the engineers.

3 Circle Venn. Venn Diagram Example

This example shows the 3 Circle Venn Diagram. The Venn Diagrams visualize all possible logical intersections between several sets. On this example you can see the intersections of 3 sets. Venn Diagrams are widely used in mathematics, logic, statistics, marketing, sociology, etc.

fishbone diagram, Ishikawa diagram, cause and effect analysis Fishbone Diagram

fishbone diagram, Ishikawa diagram, cause and effect analysis
Fishbone Diagrams solution extends ConceptDraw DIAGRAM software with templates, samples and library of vector stencils for drawing the Ishikawa diagrams for cause and effect analysis.
HelpDesk

How to Draw a Flat Organizational Chart

A clear organizational chart helps you to understand the relationships of positions in an organization in terms of authority and responsibility. A Flat organizational structure is one of the most typical organizational structure. Use The Flat Organizational chart template to draw the organizational structure of your company. ConceptDraw 25 Typical Orgcharts solution provides you with the possibility to develop typical organizational charts quickly and easily.

aerospace symbols, transport symbols Aerospace and Transport

aerospace symbols, transport symbols
This solution extends ConceptDraw DIAGRAM software with templates, samples and library of vector clipart for drawing the Aerospace and Transport Illustrations. It contains clipart of aerospace objects and transportation vehicles, office buildings and anci
HelpDesk

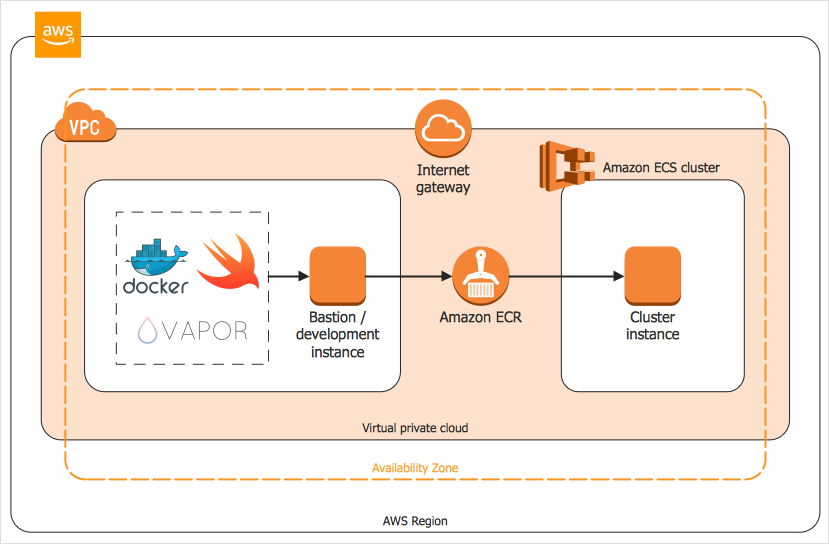
How to Create an AWS Architecture Diagram

Displaying an Amazon Web Service (AWS) cloud actually requires large amounts of attention to detail. Every element of technology has to be addressed: software, middleware, transaction processing, scaling, data storage; the complete list is staggering. Using the ConceptDraw AWS Architecture Diagrams solution makes much easier the work on documenting the Amazon Web Service architecture. The ConceptDraw AWS Architecture Diagrams solution includes icons, sample, and templates for some Amazon Web Services products and resources, to be used when building architecture diagrams. The icons are simple so that user can easily incorporate them in his drawings. AWS Architecture Diagrams can be used in presentations, datasheets, or any other technical visualizations.

Data Flow Diagram

Data flow diagram (DFD) is the part of the SSADM method (Structured Systems Analysis and Design Methodology), intended for analysis and information systems projection. Data flow diagrams are intended for graphical representation of data flows in the information system and for analysis of data processing during the structural projection. Data flow diagram often used in connection with human process and can be displayed as workflow diagram. The critical Process Flow Diagram is another flowchart technique for designing data flow in connection with organizational processes. The critical Process flow diagram may use different range of symbols than a classic workflow diagram.
HelpDesk

How to Draw a Circular Arrows Diagram

The cyclic recurrence is a fundamental property of multiple systems. The cycle is a process which consists of elements (phases, stages, stages) following each other. Many processes in astronomy, biology, chemistry, physics, mathematics, etc. have a cycle properties. It is also widely used in information technologies and marketing analysis. Graphical representation of cyclic processes can have many forms. It can be a circle, parabola, hyperbola, ellipse, and others. A Circular Arrows Diagram is used as one of the statistical charts in the business, mass media and marketing. ConceptDraw DIAGRAM provides tools for making easy drawing Circular Arrows Diagrams.
HelpDesk

How to Create Cisco Network Diagram

The easiest way to design Cisco Network diagram using standard Cisco product symbols is using ConceptDraw DIAGRAM powered by Cisco Network Diagrams solution. The Cisco Network Diagrams solution uses Cisco network symbols to visually document the topology and design of Cisco networks.

Network Topology Illustration

ConceptDraw DIAGRAM is the best software for illustration the network topologies. It's very easy and quickly to design the network topology diagrams of any kinds and complexity in ConceptDraw DIAGRAM diagramming and vector drawing software using the Computer and Networks solution from Computer and Networks area of ConceptDraw Solution Park.

Biology Drawing Software

Biology is incredibly interesting and useful natural science which studies all living things on the earth (people, animals, plants), structure, functions, interactions, evolution of living organisms. Biologists of the whole world use actively illustrations and drawings in your science and education activity. To facilitate their task of biology drawing, ConceptDraw DIAGRAM diagramming and vector drawing software was extended with Biology solution from the Science and Education area. Now, ConceptDraw DIAGRAM is a powerful biology drawing software.