Auditing Process. Audit Planning Process

Audit Process Flowchart. Audit Flowchart

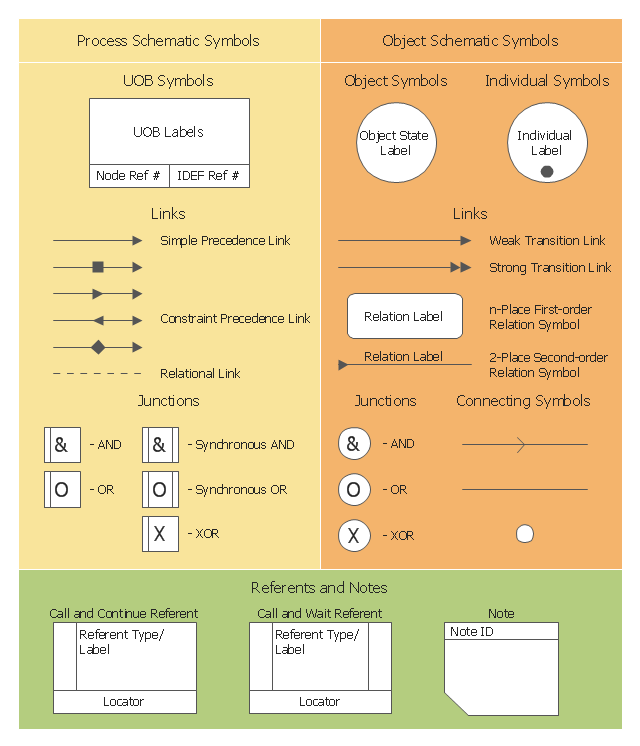
This IDEF3 symbols example was redesigned from the Wikimedia Commons file: 3-01a Symbols Used for IDEF3 Process Description Schematics.jpg.
[commons.wikimedia.org/ wiki/ File:3-01a_ Symbols_ Used_ for_ IDEF3_ Process_ Description_ Schematics.jpg]
"Process schematics tend to be the most familiar and broadly used component of the IDEF3 method. These schematics provide a visualization mechanism for process-centered descriptions of a scenario. The graphical elements that comprise process schematics include Unit of Behavior (UOB) boxes, precedence links, junctions, referents, and notes. Referents and notes are constructs that are common across process and object schematics. Each of the graphical elements used for developing process schematics is presented below, together with discussions of how to formulate more complex statements using those graphical elements. The discussion begins with the most fundamental of these building blocks: the UOB." [IDEF3 Process Description Capture Method Report AL-TR-1995-XXXX. idef.com/ pdf/ Idef3_ fn.pdf]
The sample "Symbols used for IDEF3 process description schematics" was created using the ConceptDraw PRO diagramming and vector drawing software extended with the solution "IDEF Business Process Diagrams" from the area "Business Processes" of ConceptDraw Solution Park.
IDEF3 diagram symbols
Audit Steps

Value-Stream Mapping for Manufacturing
")
How To Create a Flow Chart in ConceptDraw

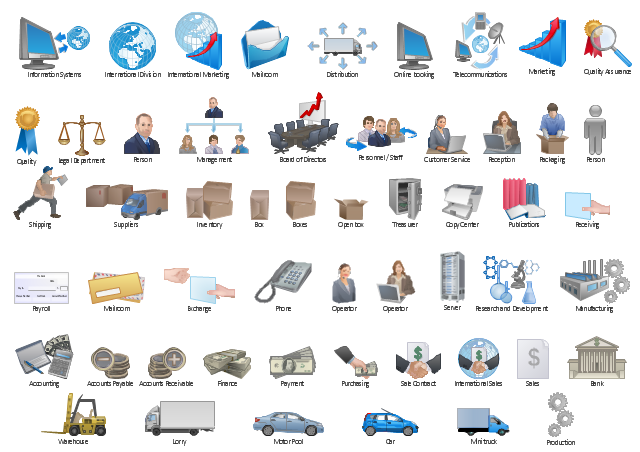
The vector stencils library "Workflow diagrams" contains 54 symbol icons for drawing the work flow charts.
Use these clipart to represent information flow, automation of business processes, business process re-engineering, accounting, management, and human resources tasks in industry, business, and manufacturing.
"A workflow consists of an orchestrated and repeatable pattern of business activity enabled by the systematic organization of resources into processes that transform materials, provide services, or process information. It can be depicted as a sequence of operations, declared as work of a person or group, an organization of staff, or one or more simple or complex mechanisms.
From a more abstract or higher-level perspective, workflow may be a view or representation of real work, thus serving as a virtual representation of actual work. The flow being described may refer to a document, service or product that is being transferred from one step to another.
Workflows may be viewed as one fundamental building block to be combined with other parts of an organisation's structure such as information silos, teams, projects, policies and hierarchies." [Workflow. Wikipedia]
The clipart example "Design elements - Workflow diagram" was drawn using the ConceptDraw PRO diagramming and vector drawing software extended with the Workflow Diagrams solution from the Business Processes area of ConceptDraw Solution Park.
Workflow symbols
Fault Tree Analysis Software

Value Stream Management

 Audit Flowcharts
Audit flowcharts solution extends ConceptDraw PRO software with templates, samples and library of vector stencils for drawing the audit and fiscal flow charts.
Mind Mapping in the Quality Management

HelpDesk
How to Create a VSM Diagram Using ConceptDraw Value Stream Mapping Solution
 example")
Best Mind Mapping Program for Making Presentations

Quality Management System

Amazon Cloud

- Basic Flowchart Symbols and Meaning | Process Flowchart | Pie ...
- Fundamental Of Business Flow Process
- Mechanical Fundamental Symbols
- Process Flowchart | Basic Flowchart Symbols and Meaning ...
- Basic Flowchart Symbols and Meaning | Audit Flowchart Symbols ...
- Basic Flowchart Symbols and Meaning | Process Flowchart ...
- Basic Flowchart Symbols and Meaning | Process Flowchart | Value ...
- Basic Flowchart Symbols and Meaning | Process Flowchart | How to ...
- Swim Lane Flowchart Symbols | Cross-Functional Flowchart (Swim ...
- Sales Call | Fundamental Tool in Quality Management | Online ...
- Process Flowchart | Flowchart Maker | Basic Flowchart Symbols and ...
- Basic Flowchart Symbols and Meaning | Data Flow Diagram ...
- Process Flowchart | Azure Storage | How To use Landscape Design ...
- Process Flowchart | Flowchart Components | Basic Flowchart ...
- Sales Process Flowchart. Flowchart Examples | Sales Process ...
- HR Flowchart Symbols | HR Flowcharts | Human Resource ...
- Process Flowchart | Ice Hockey | Quality Mind Map | Diagram And ...
- Basic Flowchart Symbols and Meaning | Process Flowchart | Types ...
- Process Flowchart | Basic Flowchart Symbols and Meaning ...
- Business Process Flowchart Symbols | Basic Flowchart Symbols ...