This site uses cookies. By continuing to browse the ConceptDraw site you are agreeing to our Use of Site Cookies.

Bubble Map Maker

The Bubble Map is a popular tool for visualization a data set which is widely used in economics, medicine, software engineering, architecture, and many other fields. Each bubble on the Bubble Map is characterized by coordinates, color and size. ConceptDraw DIAGRAM diagramming and vector drawing software extended with Bubble Diagrams Solution from the "Diagrams" Area is a powerful Bubble Map Maker.

Bubble diagrams with ConceptDraw DIAGRAM

Using ConceptDraw you will be able to create bubble diagrams from the ready ConceptDraw library objects or make your own objects. The created diagram can be saved and edited, objects can be moved and links between them will be automatically repainted after object moving because of using the ConceptDraw connectors.
HelpDesk

How To Create Visio Bubble Chart

ConceptDraw DIAGRAM allows you to easily create business charts and diagrams of any complexity, including the bubbles diagram and then make an MS Visio file from your diagram in a few simple steps.
HelpDesk

How to Add a Bubble Diagram to PowerPoint Presentation

Bubble diagrams can be used to compare concepts and identify areas of similarity and difference. ConceptDraw DIAGRAM allows you to make an MS PowerPoint Presentation from your charts in a few simple steps. A bubble diagram is a chart that represents information visually in the form of a series of bubbles. Bubble charts are often used in marketing and management during the early stages of product development to visualize ideas and concepts by organizing them in a hierarchy. The ability to create this form of a diagram is contained within the Bubble Diagrams solution. A PowerPoint presentation of bubble diagrams can be used to demonstrate and identify areas of similarity and difference of featured business ideas and concepts.

Bubble diagrams in Landscape Design with ConceptDraw DIAGRAM

To define the links between the different areas of your own landscape design and see the project from aside, we recommend to draw landscape diagram called bubble one which is analogue of «mind maps» as it allows us to create approximate image of our future proper landscape view. Use special libraries (and we have plenty of them) with objects of landscape design to be able to create the detailed plan of your landscape which will be looking so smart and professionally good as the samples we provide were created by designers who know so much about making such kinds of design plans. Having ConceptDraw DIAGRAM as the assistant in your work, will ensure the success after using our product. Make the bubble diagrams as well as any other ones in minutes with ease having our application called ConceptDraw DIAGRAM and you will see how quick it will change your life simplifying lots of work.

Tools to Create Your Own Infographics

Over the past few centuries, data visualization has evolved so much that we use it every day in all areas of our lives. Many believe that infographic is an effective tool of storytelling, as well as analytics, and that it is able to overcome most of the language and educational barriers. Understanding the mechanisms of human perception will help you to understand how abstract forms and colors used in data visualization can transmit information more efficient than long paragraphs of text.

bubble chart, bubble chart creator, bubble diagram Bubble Diagrams

bubble chart, bubble chart creator, bubble diagram
Bubble diagrams have enjoyed great success in software engineering, architecture, economics, medicine, landscape design, scientific and educational process, for ideas organization during brainstorming, for making business illustrations, presentations, planning, design, and strategy development. They are popular because of their simplicity and their powerful visual communication attributes.
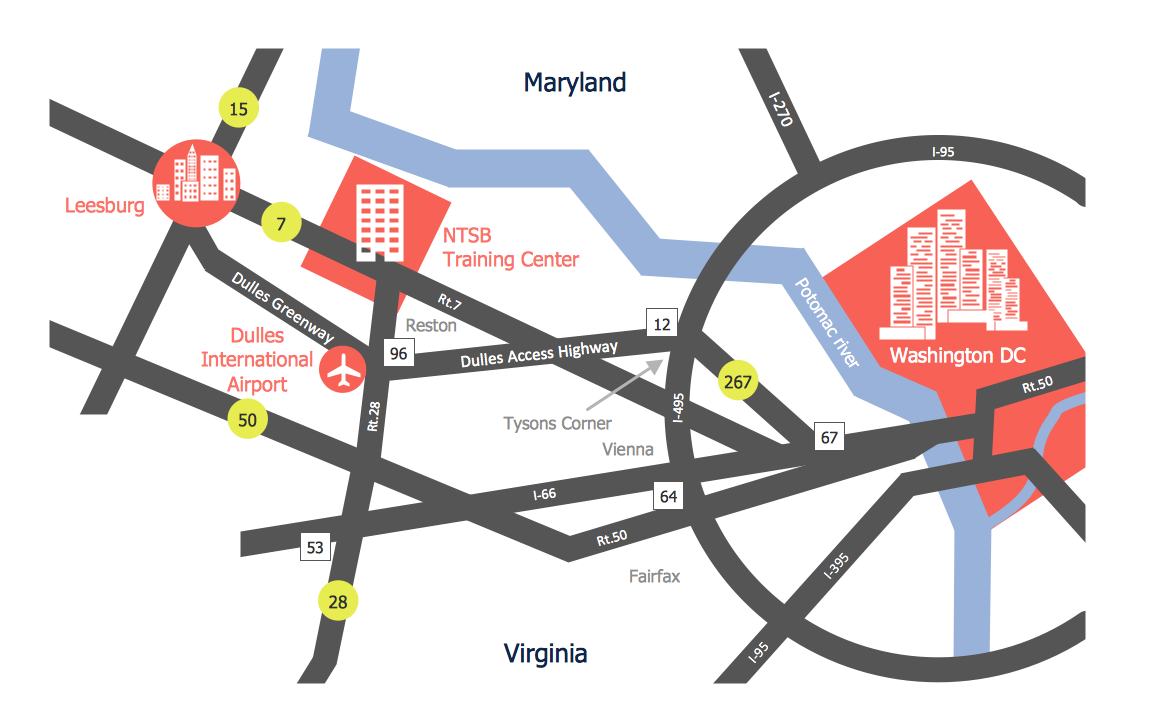
Directions Maps

It is convenient to represent various routes, directions, roads on the directional maps and navigation schemes. ConceptDraw DIAGRAM diagramming and vector drawing software supplied with Directional Maps Solution from the Maps Area of ConceptDraw Solution Park is effective for drawing Directions Maps.

SWOT Template

The "SWOT Analysis" solution gives simple visual support for all the steps of a SWOT Analysis process. SWOT analysis is a strategic planning method used to evaluate the Strengths, Weaknesses, Opportunities, and Threats facing a project. The new template for ConceptDraw MINDMAP isually supports identifying internal and external factors that are favorable and unfavorable. When the analysis is complete, output your data to a SWOT Matrix in ConceptDraw DIAGRAM for exporting to a variety of other formats: MS Visio, PowerPoint presentation, PDF, image files, etc.

How To Make a Concept Map

How to make a Concept Map fast and easy? ConceptDraw DIAGRAM diagramming and vector drawing software extended with Concept Maps Solution from the "Diagrams" Area is the best choice for those who want design professional looking Concept Map in minutes.