This site uses cookies. By continuing to browse the ConceptDraw site you are agreeing to our Use of Site Cookies.
HelpDesk

How to Create a Bubble Diagram

Bubble Diagram is a simple chart that consists of circles (bubbles) repesening certain topics or processes. Bubbles are connected by lines depicting the type of relationships between the bubbles. The size of each bubble is depended on the importance of the entity it represents. Bubble charts are widely used throughout social, economical, medical, and other scientific researches as well as throughout architecture and business management. Bubble charts are often used during the early stages of product development to visualize thoughts and ideas for the purpose of sketching out a development plan. ConceptDraw DIAGRAM allows you to draw a bubble diagrams using the Bubble Diagrams solution.
HelpDesk

How to Add a Bubble Diagram to MS Word

A bubble diagram is used the same purpose as a scatter diagram, but in the case, if the data has three dimensions, each of that containing the set of values. A bubble chart is a diagram in which the data points are replaced with bubbles, and the size of the bubbles represents some additional dimension of the data. A bubble chart does not have the axis. The sizes of the bubbles are determined by the values in the third dimension. Any additional information about the entities beyond their three primary dimensions can be depicted by rendering bubbles in colors and patterns that are selected in a certain way. The legend containing the further information can be added to a bubble diagram. ConceptDraw DIAGRAM allows you to easily create various business management and marketing charts, including bubble diagrams and then add them to an MS Word document.
HelpDesk

How To Create Visio Bubble Chart

ConceptDraw DIAGRAM allows you to easily create business charts and diagrams of any complexity, including the bubbles diagram and then make an MS Visio file from your diagram in a few simple steps.
HelpDesk

How to Add a Bubble Diagram to PowerPoint Presentation

Bubble diagrams can be used to compare concepts and identify areas of similarity and difference. ConceptDraw DIAGRAM allows you to make an MS PowerPoint Presentation from your charts in a few simple steps. A bubble diagram is a chart that represents information visually in the form of a series of bubbles. Bubble charts are often used in marketing and management during the early stages of product development to visualize ideas and concepts by organizing them in a hierarchy. The ability to create this form of a diagram is contained within the Bubble Diagrams solution. A PowerPoint presentation of bubble diagrams can be used to demonstrate and identify areas of similarity and difference of featured business ideas and concepts.

ConceptDraw Solution Park ConceptDraw Solution Park

ConceptDraw Solution Park
ConceptDraw Solution Park collects graphic extensions, examples and learning materials
HelpDesk

How to Create Organizational Chart Quickly

Use ConceptDraw MINDMAP for generating structured data on organization structure and then ConceptDraw DIAGRAM for presenting the results as chart.

Interior Design. Storage and Distribution — Design Elements

A factory plant might contain various elements including heavy goods vehicles, picking cranes, conveyor belts, storage and distribution, and machinery — all of which can be included in a design using the Plant Layout solution.
HelpDesk

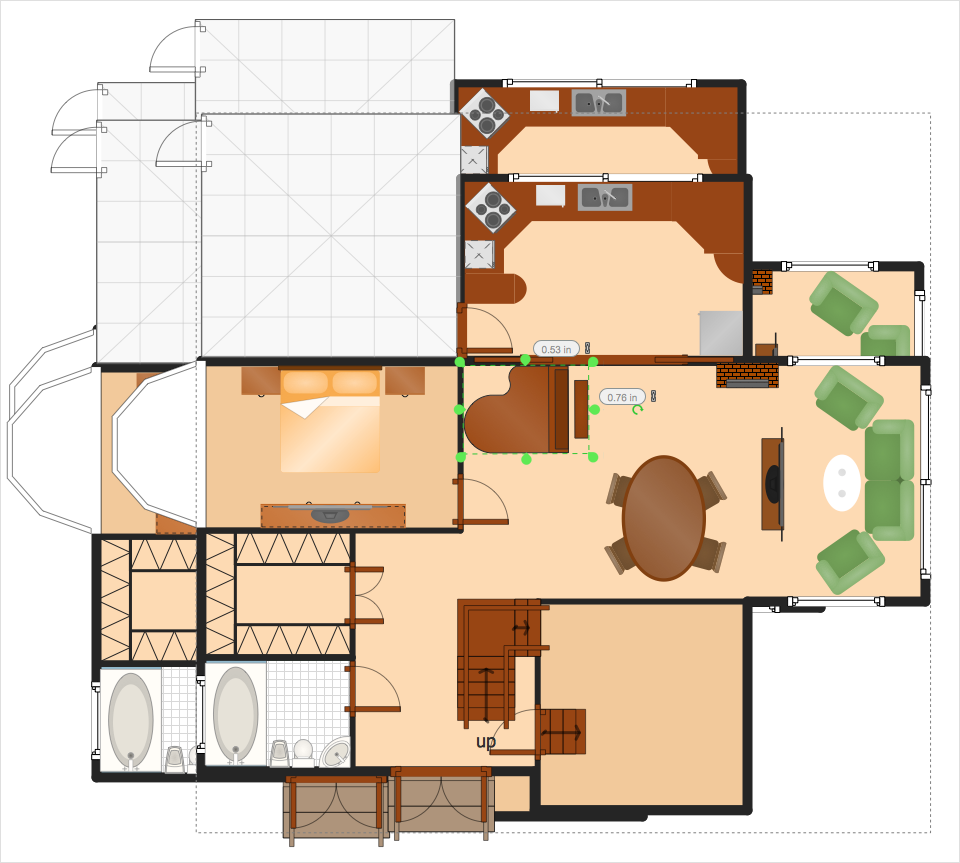
How to Add a Floor Plan to MS Word Document

ConceptDraw DIAGRAM allows you to easily create floor plans of any complexity and then insert them into an MS Word document.
HelpDesk

How to Change the Measurement Units and Drawing Scale

ConceptDraw DIAGRAM enables choosing the most suitable scale and units of measurement with just one click.
There are different units of measurement that can be used for length dimensions. When making scaled drawing we can't keep in mind just meters, centimeters, and millimeters; we also need to remember about yards, feet, and inches. This is because the United States applies its own system of measurement units, while the rest of the world employs metric measurement units. This article explains how you can change the scale and measurement units in a ConceptDraw DIAGRAM drawing.
HelpDesk

How To Create a PERT Chart Using PM Easy Solution

Project Evaluation and Review Technique (PERT) is a method of project tasks evaluation and analysis. PERT - is a method of analyzing the tasks required to complete the project. It includes analysis of the time required to complete each task, as well as the determination of the time required to carry out the whole project. PERT was developed to facilitate the planning of huge and complex projects. PERT is used for very large, complex, and non-standard projects. Technology implies the presence of uncertainty, making it possible to develop a schedule of the project without precise information on details and time required for all of its components. The most popular part of PERT is a method of the critical path, based on the construction of the network schedule (PERT network diagram). ConceptDraw Office delivers you the best way to create PERT chart for your project using compatibility between ConceptDraw PROJECT and ConceptDraw DIAGRAM.
HelpDesk

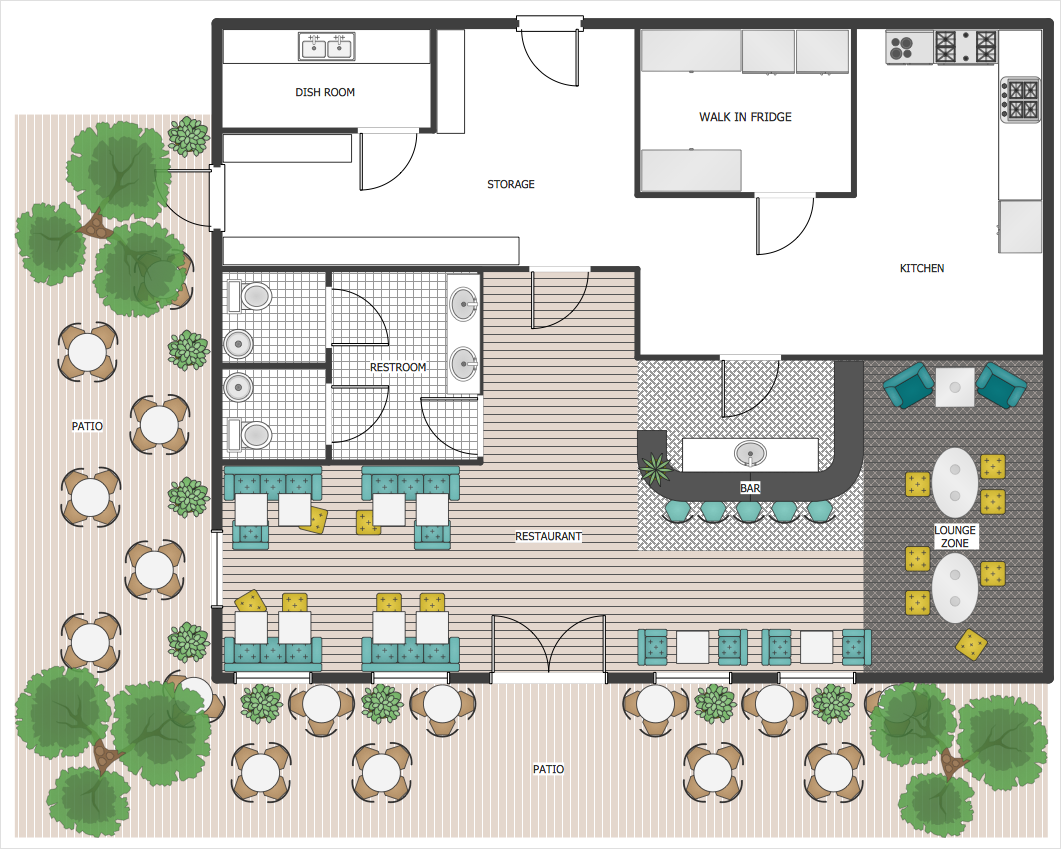
Restaurant Floor Plan Maker

The ConceptDraw Cafe and Restaurant Floor Plans solution includes libraries that are tailored for Cafe and Restaurants floor plans and interiors. Someone might think that creating a plan of cafe or restaurant is quite simple. But in fact, it is a real art. You need to make it not only beautiful but also convenient for visitors. Today, restaurants and cafes are not only the places, where people eat, but a place for business meetings, and recreation. Therefore, a well-designed project of the restaurant (cafe, bar) leads to successful sales and good incomes.
HelpDesk

How to Connect Objects on PC

ConceptDraw DIAGRAM provides a few options for drawing connections between objects: Direct Connectors,
Smart, Arc, Bezier, Curve and Round Connectors. You can connect objects in your ConceptDraw drawing with proper connectors using the embedded automatic connection modes. This article describes how you can connect objects with connectors and how you can describe different types and behaviors.
HelpDesk

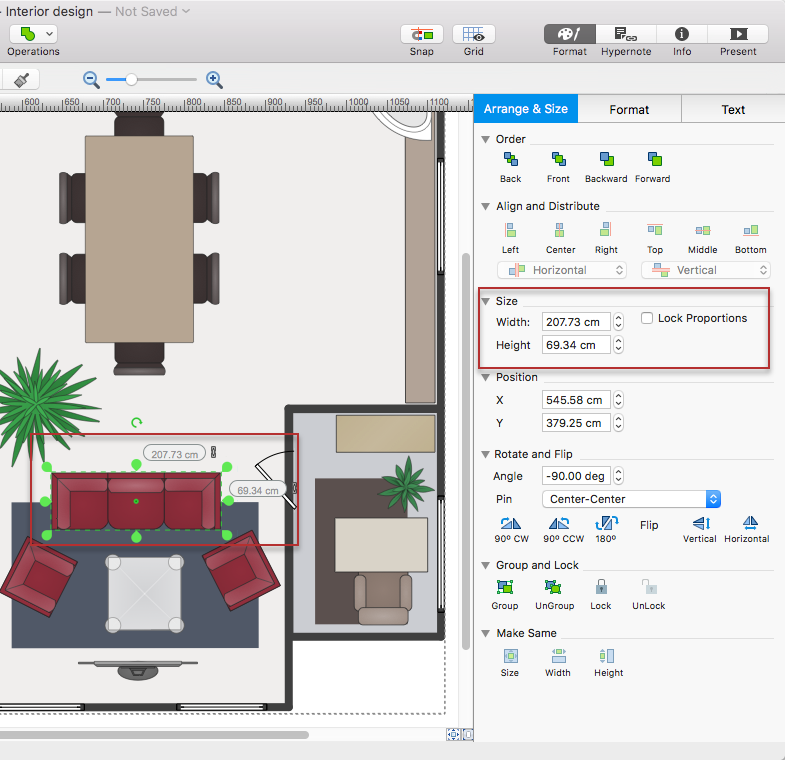
How to Resize Objects

When creating a diagram using ConceptDraw DIAGRAM, you can select, move, resize and rotate objects. After selecting an object (or objects) in a document, you can change its position, resize it or move an object to the desired position. The sizes of objects in the ConceptDraw DIAGRAM can be changed by simply dragging, or you can set a particular size of an object. Using ConceptDraw DIAGRAM, you can re-size an object on the page using the absolute measurements instead of a mouse. You can make quick work of designing complex drawing using a combination of different-sized items.
HelpDesk

How to Create a Timeline Diagram

A Timeline is a chart which displays a project plan schedule in chronological order. A Timeline is used in project management to depict project milestones and visualize project phases and show project progress. The graphic form of a timeline makes it easy to understand critical project milestones, such as the progress of a project schedule. Timelines are particularly useful for project scheduling or project management when accompanied with a Gantt chart. It captures the main of what the project will accomplish and how it will be done. making a project timeline is one of the most important skills a project manager needs have. Making comprehensive, accurate timelines allows you getting every project off in the best way. ConceptDraw DIAGRAM allows you to draw a timeline chart using a special library.