Blank Scatter Plot
This sample shows the Scatter Plot without missing categories. It’s very important to no miss the data, because this can have the grave negative consequences. The data on the Scatter Chart are represented as points with two values of variables in the Cartesian coordinates. This sample can be used in the engineering, business, statistics, analytics, at the creating the financial and other types of reports.Donut Chart Templates
These donut chart templates was designed using ConceptDraw PRO diagramming and vector drawing software extended with Pie Charts solution from Graphs and Charts area of ConceptDraw Solution Park.All these donut chart templates are included in the Pie Charts solution.
You can quickly rework these examples into your own charts by simply changing displayed data, title and legend texts.
Pie Chart Examples and Templates
A pie chart or a circle graph is a circular chart divided into sectors, illustrating numerical proportion. In a pie chart, the arc length of each sector and consequently its central angle and area, is proportional to the quantity it represents.Pie chart examples and templates created using ConceptDraw PRO software helps you get closer with pie charts and find pie chart examples suite your needs.
Radar Chart
This sample shows the Radar Chart that compares the internet dimensions in the four countries. The Radar Chart represents the multivariate data as a two-dimensional chart with three or more variables displayed on the axes that start in one point. The Radar Charts are used in the quality management, business, analytics and sport.How Do You Make a Histogram?
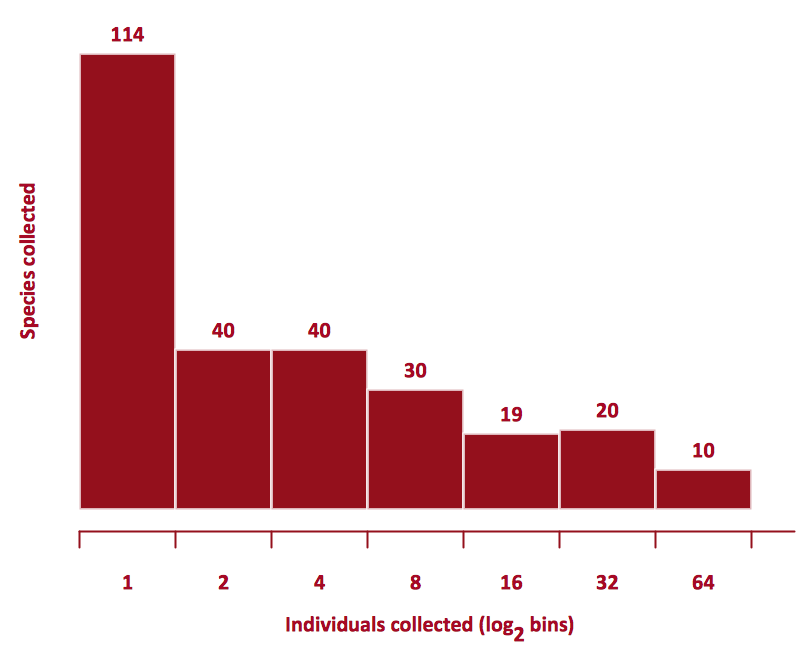
How do you make a histogram usually? Drawing of histogram is quite complex and lengthy process. Usually you have a set of data and you draw free-hand your diagram according to these data. But now thanks to the ConceptDraw PRO diagramming and vector drawing software extended with Histograms solution from the Graphs and Charts Area of ConceptDraw Solution Park this process became simple and fast.
 Seating Plans
The correct and convenient arrangement of tables, chairs and other furniture in auditoriums, theaters, cinemas, banquet halls, restaurants, and many other premises and buildings which accommodate large quantity of people, has great value and in many cases requires drawing detailed plans. The Seating Plans Solution is specially developed for their easy construction.
 Pie Charts
Pie Charts solution extends ConceptDraw PRO software with templates, samples and library of vector stencils for drawing the pie and donut charts.
Healthy Foods
Use of various charts, diagrams and infographics is the most effective way of visual presenting information about healthy foods, healthy eating and healthy diet. ConceptDraw PRO diagramming and vector drawing software offers the Health Food solution from the Food and Beverage area of ConceptDraw Solution Park which is overfull of powerful drawing tools, libraries with ready-to-use vector objects and clipart, predesigned samples and examples which will help you easy design healthy foods illustrations.
 Network Layout Floor Plans
Network Layout Floor Plan solution extends ConceptDraw PR software with samples, templates and libraries of vector stencils for drawing the computer network layout floor plans.
 Football
The Football Solution extends ConceptDraw PRO v9.5 (or later) software with samples, templates, and libraries of vector objects for drawing football (American) diagrams, plays schemas, and illustrations. It can be used to make professional looking documen
- Bubble Plot | Four Dimensions Bubble Plot | Blank Scatter Plot | Plot ...
- Scatter Chart Examples | Scatter Diagram | Blank Scatter Plot ...
- Scatter Chart Examples | Scatter Diagrams | Blank Scatter Plot ...
- Fundraising Pyramid | Pyramid Diagrams | Pyramid Chart Examples ...
- Design elements - Correlation charts | Line Chart Examples | Scatter ...
- Business Reports Pie Charts
- Scatter Graph Charting Software | Blank Scatter Plot | Scatter ...
- How to Create a Scatter Chart | How to Draw a Scatter Diagram ...
- Blank Calendar Template | Blank Calendar | Pie Charts | Blank ...
- Doughnut Chart Template
- Blank Calendar Template | Blank Calendar | Economic Calendar ...
- 4 Level pyramid model diagram - Information systems types ...
- Scatter Chart Analysis. Scatter Chart Example | Scatter Chart ...
- Target Diagram | Target and Circular Diagrams | Daily Schedule ...
- 5-Set Venn diagram - Template | Workflow Diagram Template ...
- Scatter Chart Examples | How to Draw a Scatter Diagram | Scatter ...
- Flowchart Software | Flow Chart Template | Cross-Functional ...
- Donut Chart Templates | Pie Chart Examples and Templates | Donut ...
- Business diagrams & Org Charts with ConceptDraw PRO


