Material Requisition Flowchart. Flowchart Examples
Material requisition is a request generated by internal or external organization with a goal to inform the purchase department about the needed items and materials. The requisition can be represented as a written document on a pre-printed form or online request in form of electronic document. The electronic inquisition occupies a leading position in a modern world, now the paper forms are replaced by electronic ordering processes and workflows. The requisition is actively used in business as an internal document for notification the store about the needed goods, in medicine for making the orders on medical equipment and medicaments, in industry for creation request for purchasing some items and materials, and so on. ConceptDraw DIAGRAM ector graphics software extended with Flowcharts solution from the Diagrams area is powerful and useful tool for drawing various types of Flowcharts, including without doubt the Material Requisition Flowchart of any degree of detailing. Succeed in drawing using the large quantity of predesigned flowchart specific shapes, symbols and icons.F&B
High competition among the restaurants at the food court requires original design ideas. To attract visitors and increase sales are used many kinds of advertising products, brightly colored signboards, menus and show-cases, often are used the molds of beautifully decorated dishes. Now designing of colorful F&B (food and beverage) materials is easier than ever thanks to the ConceptDraw DIAGRAM diagramming and vector drawing software extended with Food Court Solution from the Food and Beverage Area of ConceptDraw Solution Park.
 Food Court
Use the Food Court solution to create food art. Pictures of food can be designed using libraries of food images, fruit art and pictures of vegetables.
 Cross-Functional Flowcharts
Cross-functional flowcharts are powerful and useful tool for visualizing and analyzing complex business processes which requires involvement of multiple people, teams or even departments. They let clearly represent a sequence of the process steps, the order of operations, relationships between processes and responsible functional units (such as departments or positions).
 Health Food
The Health Food solution contains the set of professionally designed samples and large collection of vector graphic libraries of healthy foods symbols of fruits, vegetables, herbs, nuts, beans, seafood, meat, dairy foods, drinks, which give powerful possi
 Divided Bar Diagrams
The Divided Bar Diagrams Solution extends the capabilities of ConceptDraw DIAGRAM with templates, samples, and a library of vector stencils for drawing high impact and professional Divided Bar Diagrams and Graphs, Bar Diagram Math, and Stacked Graph.
Holiday Recipes
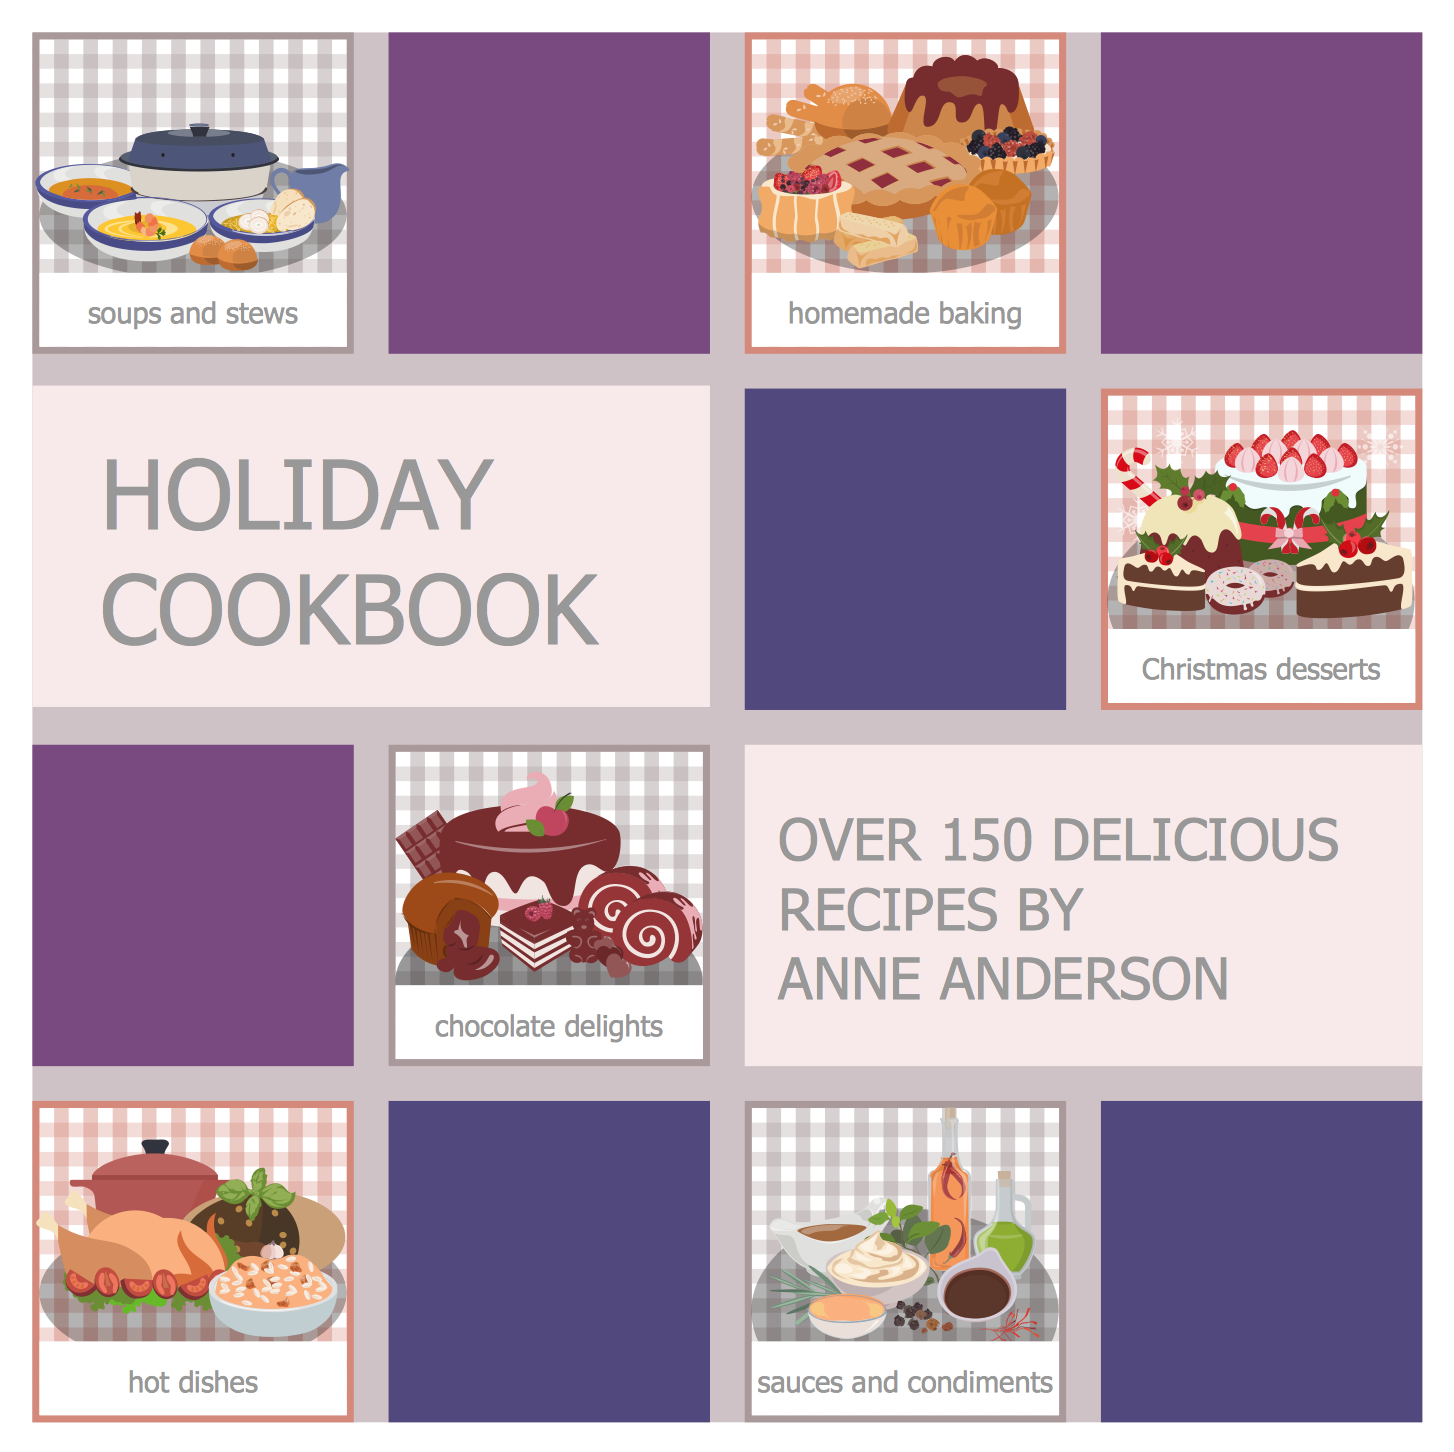
Holiday recipes are always recipes of amazingly delicious and beautiful dishes that delight by decoration and miraculous combination of ingredients, and remain long in the memory. Design of illustrations for recipes of holiday dishes for cookbooks, magazines and websites is a special art, because one of the main criteria for selection the recipe and its next cooking is colorful and appetizing illustration. ConceptDraw DIAGRAM diagramming and vector drawing software extended with powerful tools of Cooking Recipes solution from the Food and Beverage area of ConceptDraw Solution Park will help easy create colorful, bright, attractive and appetizing illustrations on preparation and decoration holiday dishes.
 Audit Flowcharts
Audit flowcharts solution extends ConceptDraw DIAGRAM software with templates, samples and library of vector stencils for drawing the audit and fiscal flow charts.
 Logistics Flow Charts
Logistics Flow Charts solution extends ConceptDraw DIAGRAM functionality with opportunities of powerful logistics management software. It provides large collection of predesigned vector logistic symbols, pictograms, objects and clipart to help you design with pleasure Logistics flow chart, Logistics process flow diagram, Inventory flow chart, Warehouse flowchart, Warehouse management flow chart, Inventory control flowchart, or any other Logistics diagram. Use this solution for logistics planning, to reflect logistics activities and processes of an enterprise or firm, to depict the company's supply chains, to demonstrate the ways of enhancing the economic stability on the market, to realize logistics reforms and effective products' promotion.
Produce Professional Diagrams More Quickly, Easily and Cost Effectively
ConceptDraw Arrows10 Technology - This is more than enough versatility to produce professional diagrams more quickly. Professional diagramming software for mac helps you create variety diagrams, graphics, charts, live dashboards and plenty of graphics and pictures for your business and study.
 Basic Divided Bar Diagrams
This solution extends the capabilities of ConceptDraw DIAGRAM with templates, samples and a library of vector stencils for drawing Divided Bar diagrams.
Best Vector Drawing Application for Mac OS X
ConceptDraw DIAGRAM creates drawings, diagrams and charts with great visual appeal in Mac OS X.
 Bar Graphs
The Bar Graphs solution enhances ConceptDraw DIAGRAM functionality with templates, numerous professional-looking samples, and a library of vector stencils for drawing different types of Bar Graphs, such as Simple Bar Graph, Double Bar Graph, Divided Bar Graph, Horizontal Bar Graph, Vertical Bar Graph, and Column Bar Chart.
 Entity-Relationship Diagram (ERD)
An Entity-Relationship Diagram (ERD) is a visual presentation of entities and relationships. That type of diagrams is often used in the semi-structured or unstructured data in databases and information systems. At first glance ERD is similar to a flowch
- Organogram Software | Flow chart Example. Warehouse Flowchart ...
- Sample Of Pareto Chart In Food And Beverage
- Entity-Relationship Diagram (ERD) | Data Flow Diagrams (DFD ...
- Flow chart Example. Warehouse Flowchart | Competitor Analysis ...
- Genomics | Process Flowchart | Bar Graphs | Mind Map Of Protein
- Organogram Software | Flow chart Example. Warehouse Flowchart ...
- Image Of Balance Diet Chart For Drawing With Label
- Food Court | Health Food | Food Recipes | Food
- Sales Growth. Bar Graphs Example | Sales Process Flowchart ...
- Bar Chart Template for Word | Example of DFD for Online Store ...
- Draw A Chart Organogram Of Food And Beverages
- Picture Of Flowchart Based On Bar And Restaurant
- Process Flowchart | Basic Diagramming | Rainfall Bar Chart | Green ...
- Food Court | F&B | Fast food bar | Fast Food Menu Animation
- Process Flowchart | Health Food | Biology | Protein Mind Map Flow
- Juice bar | Juice bar | Food Court | Infographic Fruit Juices
- Copying Service Process Flowchart . Flowchart Examples | Process ...
- Food Court | How To Create Restaurant Floor Plan in Minutes | Food ...
- Design elements - Beverages | Food Court | Food and Beverage ...
- Picture Graphs | Geo Map - Asia - Philippines | Bar Diagram Math ...


