Cross-Functional Flowchart
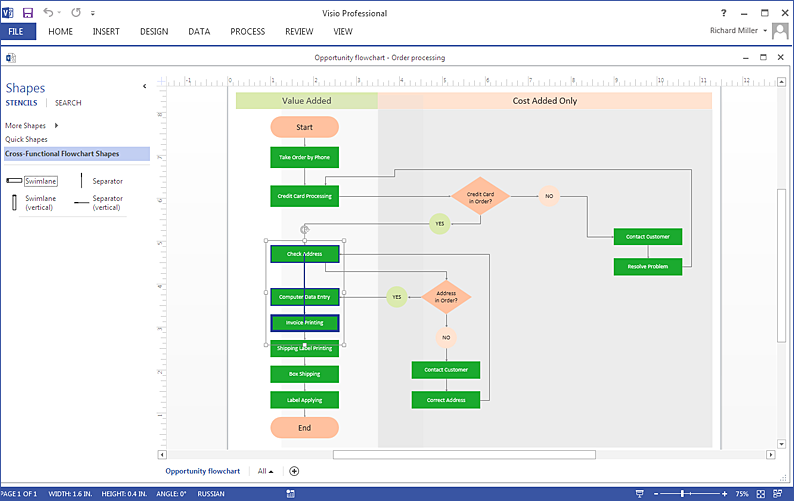
Use of Cross-Functional Flowchart is a clear way of showing each team member’s responsibilities and how processes get shared or transferred between different responsible people, teams and departments. Use the best flowchart maker ConceptDraw PRO with a range of standardized cross-functional flowchart symbols to create the Cross-Functional Flowcharts simply and to visualize the relationship between a business process and the functional units responsible for that process. To draw the most quickly Cross-Functional Flowcharts, Cross Functional Process Maps, or Cross Functional Process Flow Diagrams, start with a Cross-functional flowchart samples and templates from ConceptDraw Solution Park. The ConceptDraw Arrows10 and RapidDraw technologies will be also useful for you in drawing. ConceptDraw PRO supports designing both types - horizontal and vertical Cross-functional flowcharts. A vertical layout makes the accents mainly on the functional units while a horizontal layout - on the process. If you need a Visio alternative in Mac OS X, try ConceptDraw PRO. Its interface is very intuitive and it’s actually much easier to use than Visio, yet somehow it’s just as powerful if not more so. ConceptDraw PRO performs professional quality work and seamless Visio interaction.
Flowchart design. Flowchart symbols, shapes, stencils and icons
A flowchart is a type of diagram which represents an algorithm, process or workflow, displays the steps as boxes of various kinds and depicts their order by connecting them with arrows. Any business graphic document will be more colorful and understandable if will use professional-looking and visual diagrams and flowcharts. Flowchart design gives versatile presenting and explaining of the process. ConceptDraw PRO flowchart software enhanced with Flowcharts solution helps effectively make Flowchart Design. Use of predesigned flowchart symbols and bright color palette offers a fresh view and favorably distinguishes the flowcharts designed in ConceptDraw PRO from the black and white flowcharts on a paper. Preferably to use no more than three or four colors and apply identical for the same shape types. The best flowchart design can be achieved by starting with Flowchart template, or any of suitable ready examples or samples offered in ConceptDraw STORE, open one of them and enter the proper text into each Flowchart shape. Each symbol of the flowchart has a definition that can't be changed. This means that all flowcharts shapes can be grouped in according to their meaning. Users with ConceptDraw PRO flowchart software can style groups of symbols with close definitions by color sets chosen from complementary palette. Almost all workflows can be depicted as a flowchart. Colored diagrams are more light for perception of the certain information, this is part of flowchart design. Bright colors need to be used in the key points of Decision symbols, to focus attention on their importance for whole process flow.
HelpDesk
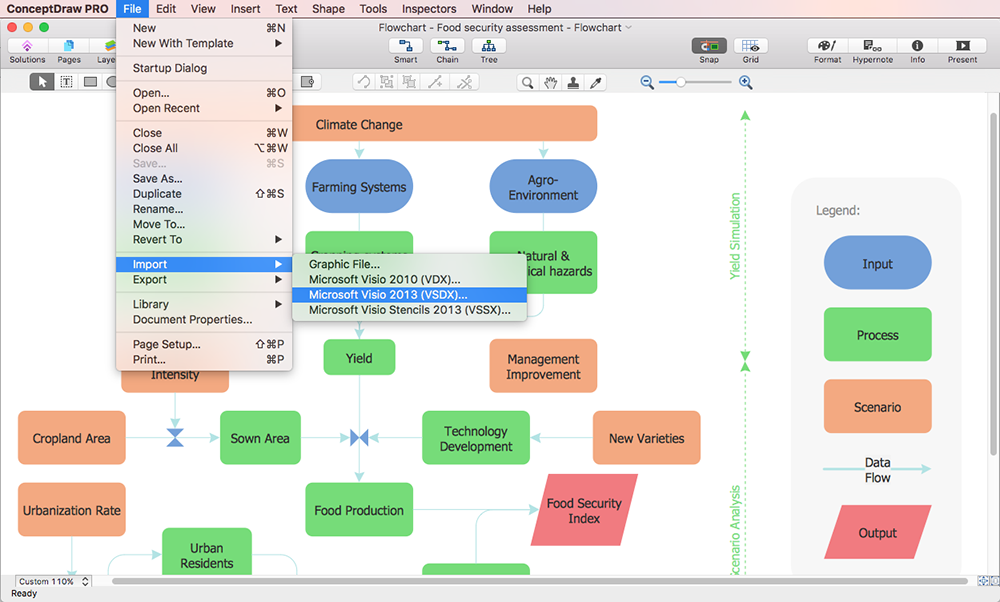
How to Open MS Visio® 2013/2016 Files on a Mac®
Powerful business graphics and diagramming tools are the norm and not the exception for today’s businesses. For years the de facto standard file format for business has been Microsoft Visio™. Many people involved in visual communication need software tools that will read and write using the Visio file format. With the introduction of Visio 2013 Microsoft has changed the native file format used in earlier versions of Microsoft Visio. ConceptDraw PRO v10 file import and export works round-trip with the new Visio VSDX file format.
 Plant Layout Plans
This solution extends ConceptDraw PRO v.9.5 plant layout software (or later) with process plant layout and piping design samples, templates and libraries of vector stencils for drawing Plant Layout plans. Use it to develop plant layouts, power plant desig
Visio Files and ConceptDraw
Visio Files and ConceptDraw. ConceptDraw PRO is compatible with MS Visio .VDX formatted files.VDX is Visio’s open XML file format, and it can be easily imported and exported by ConceptDraw PRO.
 Visio Exchange
Our Visio Exchange tool allows you to Import and export native MS Visio 2013 files that are in the new MS Visio drawing (VSDX) format introduced in the most recent Visio iteration. In addition, ConceptDraw PRO v10 supports the import and export of MS Visio 2007-2010 XML. (VDX) files more accurately then previous versions of ConceptDraw PRO. If you have the older MS Visio 2007-2010.
Basic Diagramming
Create flowcharts, organizational charts, bar charts, line graphs, and more with ConceptDraw PRO.
HelpDesk
How To Create MS Visio Cross-Functional Flowchart
Cross-functional is a process involving several functional layers. Such processes typically cause the most problems, and therefore, is the most potential for improvement. Cross-functional business processes are usually illustrate the processes of product development, commercial proposal development, the order execution process - everything, that involves several departments. The package of possible improvements - is the task of re-engineering. To illustrate the cross-functional processes often use cross-functional flowchart is often used to illustrate the cross-functional processes. ConceptDraw PRO allows you to easily create cross-functional flowchart. Then, you can export it to MS Visio VSDX or VDX format and successfully share it with your colleagues still using MS Visio.
 Accounting Flowcharts
Accounting Flowcharts solution extends ConceptDraw PRO software with templates, samples and library of vector stencils for drawing the accounting flow charts.
 Accounting Flowcharts
Accounting Flowcharts solution extends ConceptDraw PRO software with templates, samples and library of vector stencils for drawing the accounting flow charts.
HelpDesk
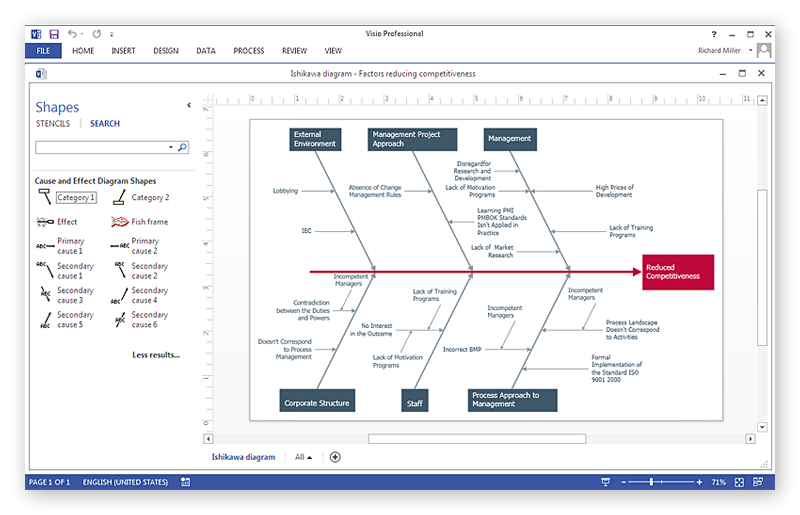
How To Create Cause and Effect (Fishbone) Diagram in MS Visio
Cause-and-Effect Ishikawa Diagram is a graphical method of analysis and cause-effect relationships, a tool in the form of fish bone. It is used to systematically determine the cause of the problem and represent it graphically. The technique is primarily used in the framework of quality management for the analysis of quality problems and their causes. Nowadays, it has found worldwide distribution and is used in multiple problem areas. It is one of the tools of lean manufacturing, which is used in group work to find the problems and their causes. ConceptDraw PRO allows you to easily create Fishbone (Ishikawa) diagram and then make a MS Visio VSDX, or VSD files from your diagrams in a couple clicks, using the export capabilities of ConcewptDraw PRO.- How to Open MS Visio® 2013 /2016 Files on a Mac® Using ...
- Flowchart Software | In searching of alternative to MS Visio for MAC ...
- Best Free Visio Alternative
- In searching of alternative to MS Visio for MAC and PC with ...
- Flowchart Software | ConceptDraw PRO Compatibility with MS Visio ...
- How to Open MS Visio® 2013 /2016 Files on a Mac® Using ...
- Flowchart Software | How to Convert Visio Custom Library to ...
- How to Open MS Visio® 2013 /2016 Files on a Mac® Using ...
- In Search of an Alternative to MS Visio for Mac | In searching of ...
- Cross Functional Flowchart Visio Examples
- Best Free Alternative To Visio
- Flowchart Software | Workflow Diagram Software Mac | Workflow ...
- Flowchart Software | IDEF0 Visio | Audio and Video Connectors ...
- Business People Clipart | How to Convert a Visio Stencils for Use in ...
- How to Open MS Visio® 2013 /2016 Files on a Mac® Using ...
- How to Convert a Visio Stencils for Use in ConceptDraw PRO ...
- Flowchart Software | Visio Exchange | IDEF0 Visio | Visio For Free ...
- Process Flowchart | Flowchart Software | Basic Flowchart Symbols ...
- Use Case Diagrams technology with ConceptDraw PRO | Best ...
- How to Open MS Visio® 2013 /2016 Files on a Mac® Using ...


