Seating Chart Template
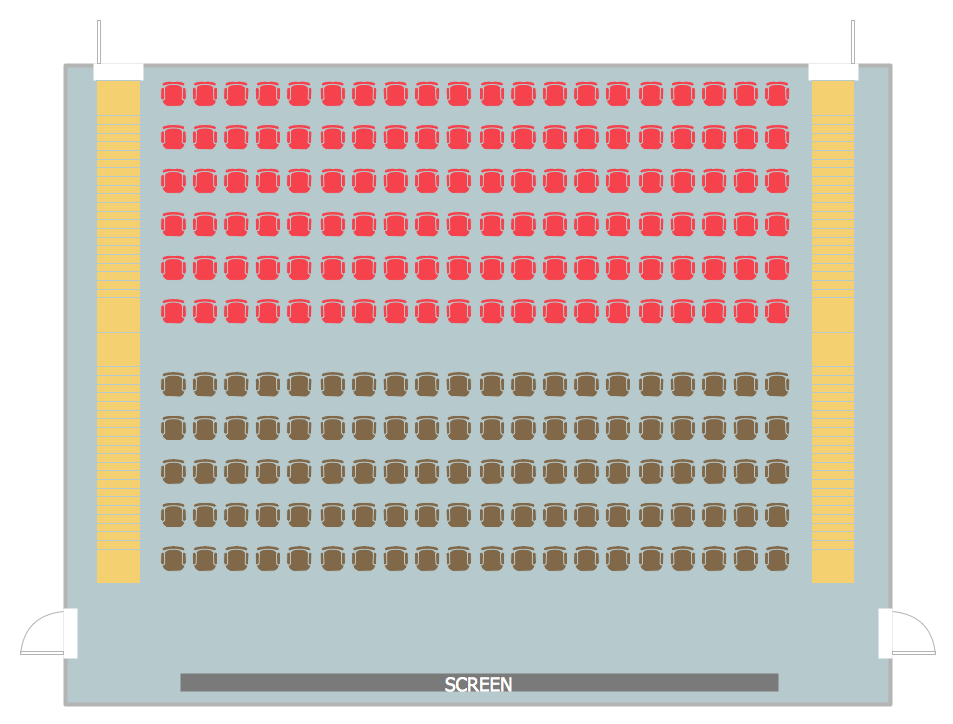
Seating chart developing is necessity for constructing and building the cinemas, theaters, banquet halls, auditoriums, and other premises for accommodation a large number of people. Seating chart template can help you design professional looking seating plan. ConceptDraw PRO diagramming and vector drawing software recommends you to use the Seating Plans solution from the Building Plans area for designing the seating charts.Chore charts with ConceptDraw PRO
Chore chart. Draw perfect-looking chore chart. Free chore chart samples. All about chore charts.Process Flow Chart
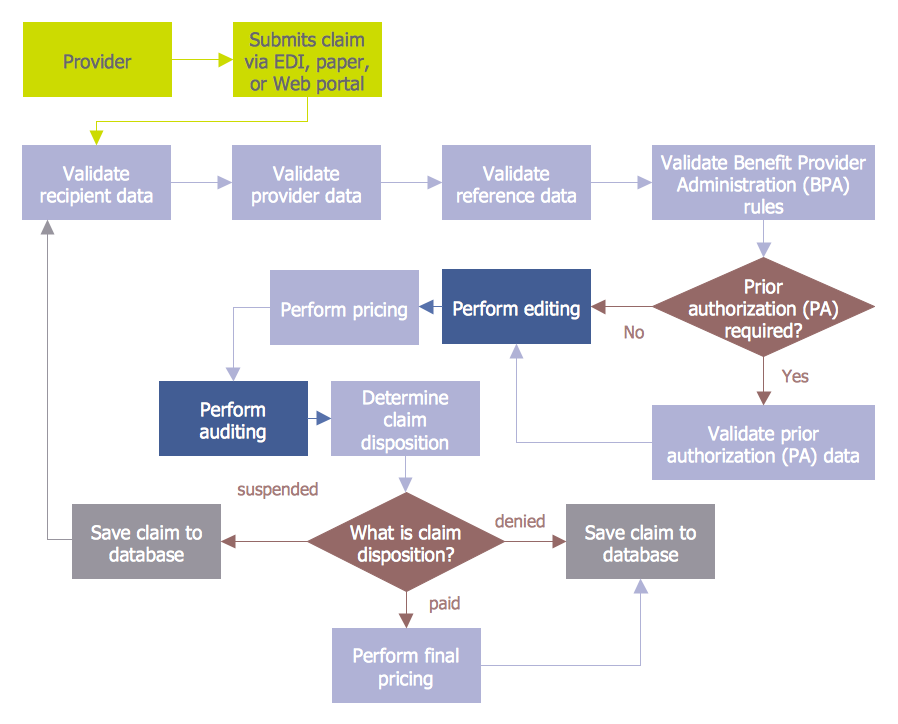
A Process Flow Chart is a type of flowchart which is mostly used in industrial, chemical and process engineering for illustrating high-level processes, major plant processes and not shows minor details. ConceptDraw PRO diagramming and vector drawing software extended with Flowcharts Solution from the "What is a Diagram" Area of ConceptDraw Solution Park is the best way to create Process Flow Chart and other types of flowcharts.Audit Procedures
Audit procedures are the specific tests and methods that auditor executes when gathering the evidence which are necessary for making an opinion on the financial statements of the firm. There are three types of audit procedures: data selection, reliability validation, relevance confirmation. Thanks to the extensive drawing tools which provides the Audit Flowcharts solution from the Finance and Accounting area of ConceptDraw Solution Park, you can easy and effectively develop and realize various audit procedures.GUI Prototyping with ConceptDraw PRO
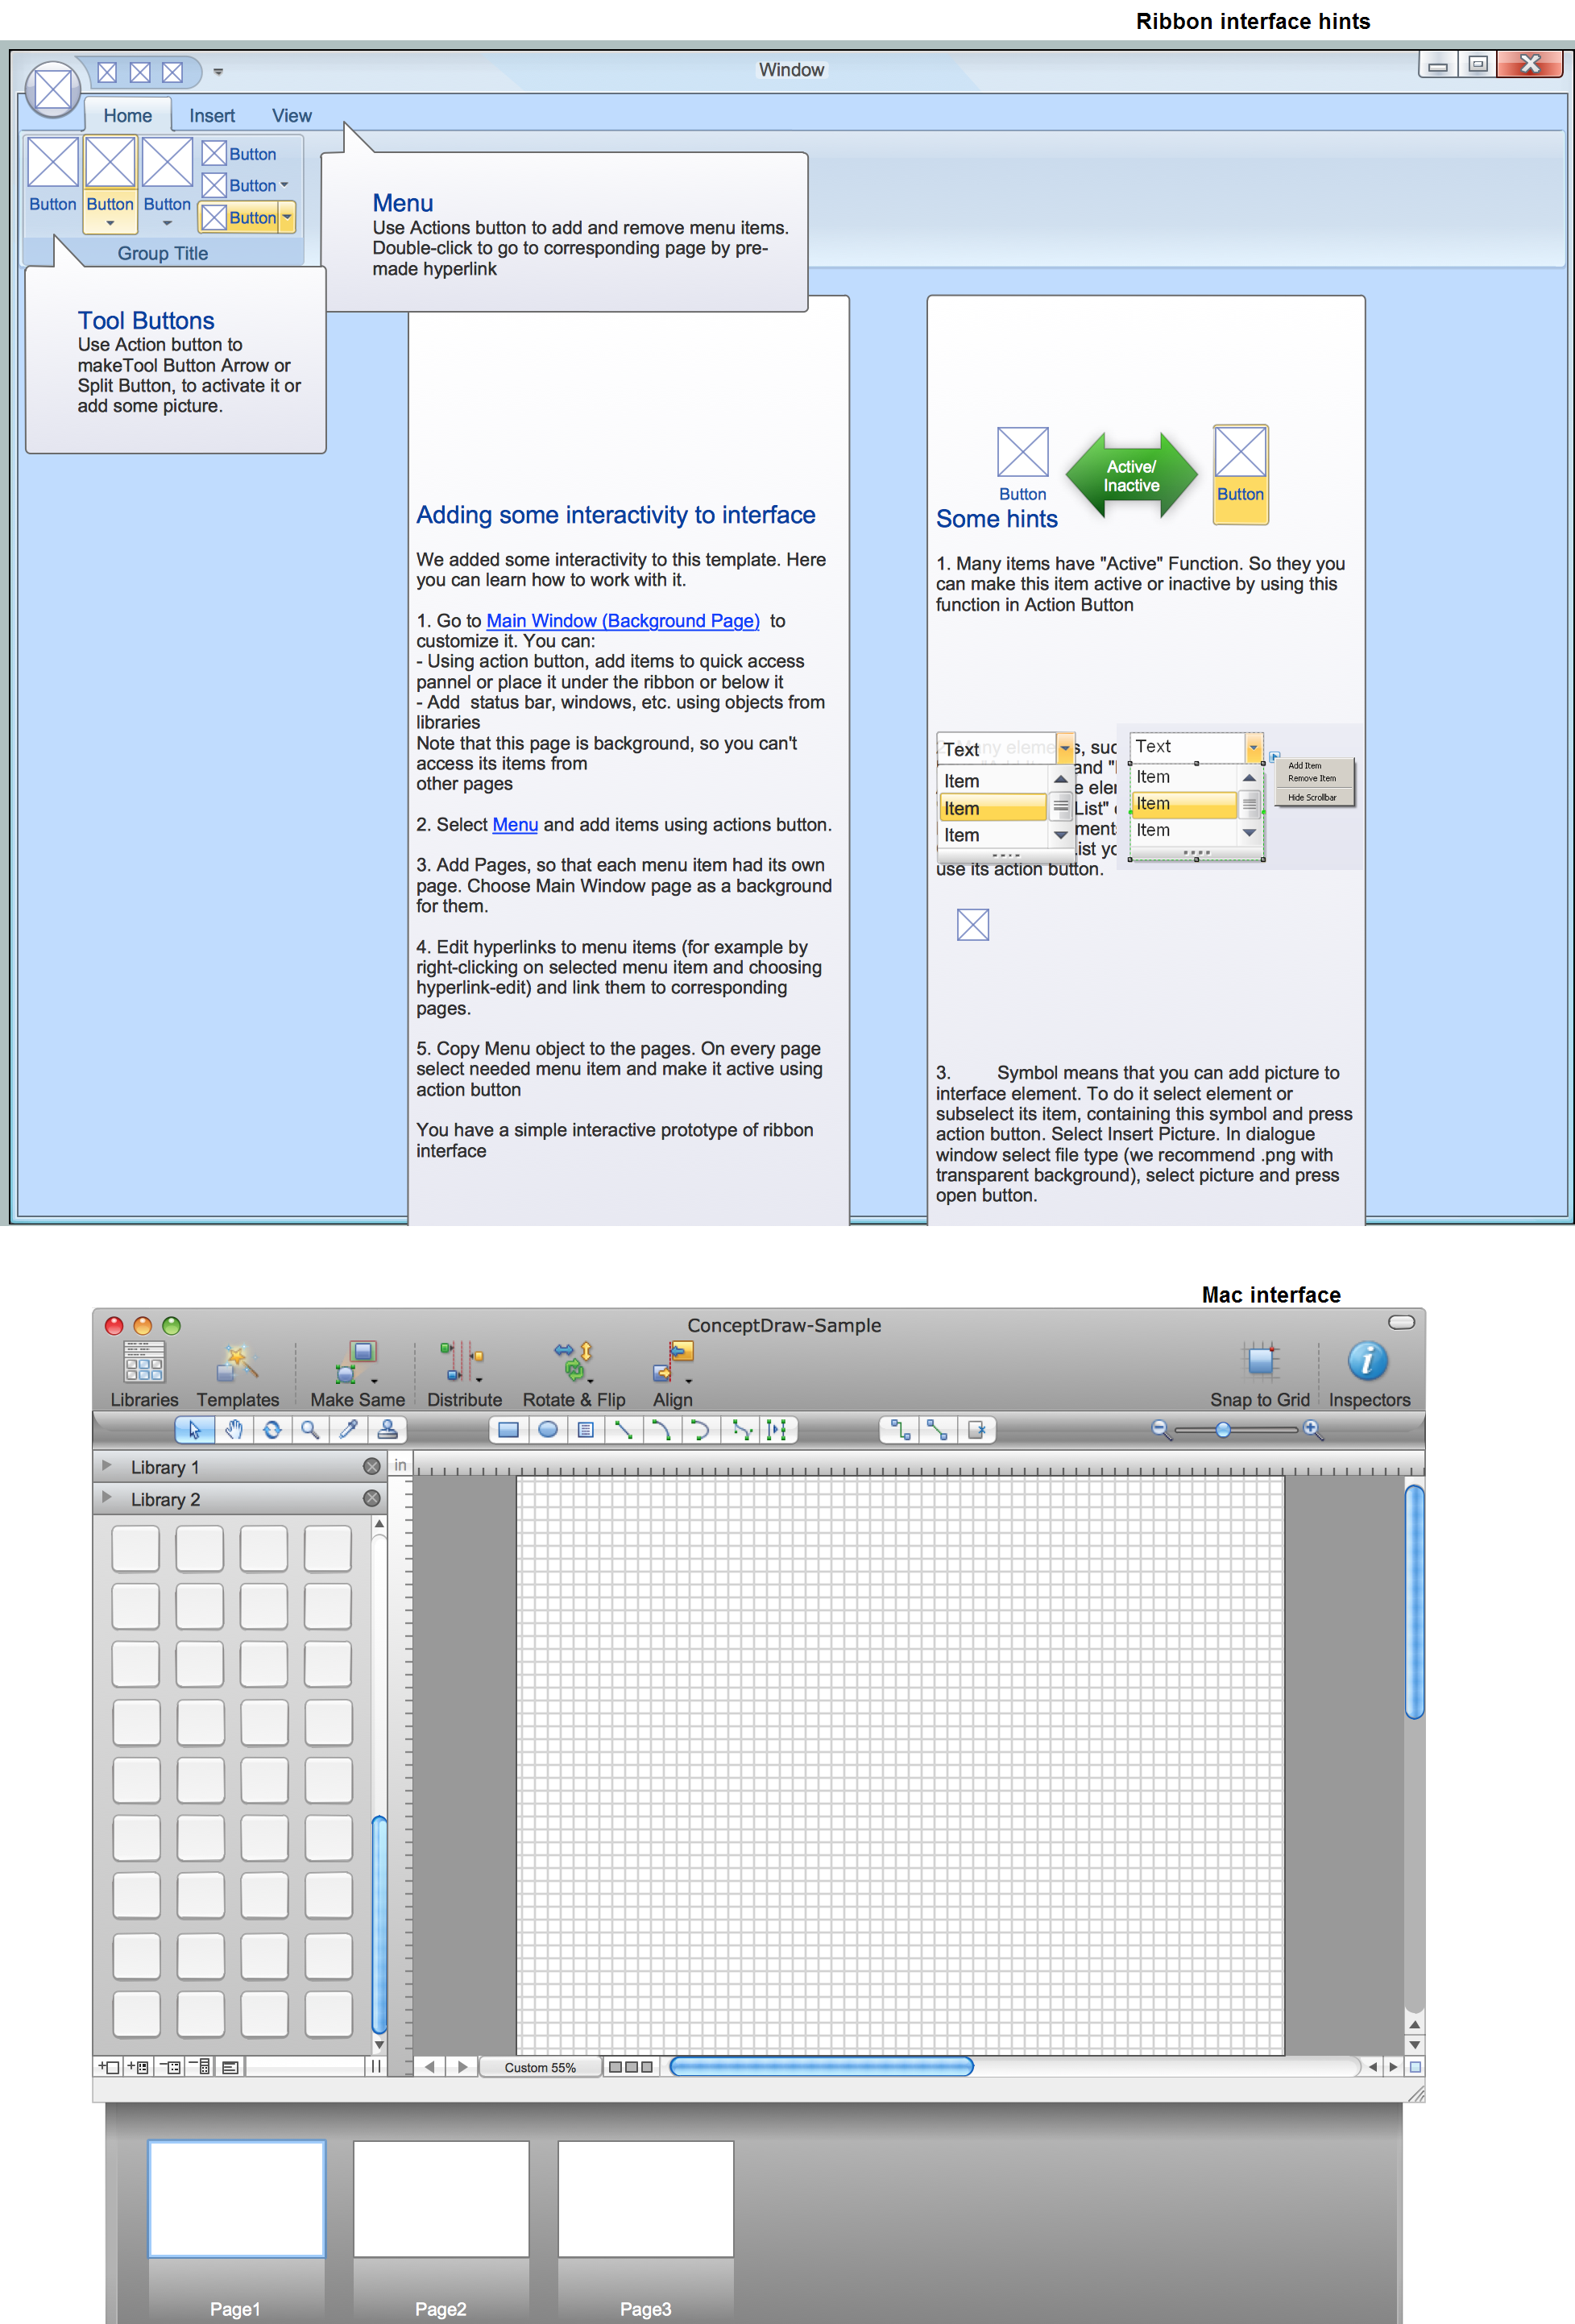
All about prototyping. GUI Prototyping with ConceptDraw. Download prototyping software.Spider Chart Template
This sample shows the Spider Chart that represents the budget and spending for one organization and allows to compare them. The multivariate data are represented on the Spider Chart as a two-dimensional chart with four or more variables displayed on the axes that start in one point. The Spider Charts are used in the management, business and sport.- How to Create Presentation of Your Project Gantt Chart | Line Graph ...
- Beautiful Gantt Charts
- How to Create Presentation of Your Project Gantt Chart | Chart ...
- Pie Chart Word Template. Pie Chart Examples | Chart Maker for ...
- How to Create Presentation of Your Project Gantt Chart | Gantt chart ...
- Chore charts with ConceptDraw PRO | Beautiful Nature Scene ...
- Chart Software for Better Presentations | Chart Maker for ...
- How to Create Presentation of Your Project Gantt Chart | Export from ...
- Samples Of Beautiful Charts With Pictures Draw On It
- Column Chart Software | Chart Maker for Presentations | Sales ...
- Images Of Pie Chart
- How to Create Presentation of Your Project Gantt Chart | Data Flow ...
- Chart Maker for Presentations | Bar Chart | Waterfall Bar Chart | Bar ...
- Beautiful Charts Pictures On Landscape
- Column Chart Examples | Chart Maker for Presentations | Column ...
- Geo Map - USA - Illinois | Types of Flowcharts | Gantt charts for ...
- Bar Diagram Math | Picture Graph | Chart Software for Better ...
- Line Chart Template for Word | Organizational Chart Templates ...
- How To Create Restaurant Floor Plan in Minutes | Table Seating ...


