This site uses cookies. By continuing to browse the ConceptDraw site you are agreeing to our Use of Site Cookies.
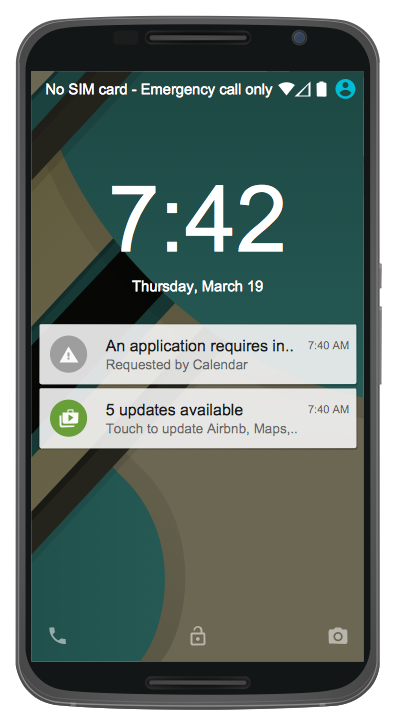
The vector stencils library "Android system icons - editor" contains 52 editor pictograms.
Use this icon set to design user interface of your Android application.
The icons example "Design elements - Android system icons (editor)" was created using the ConceptDraw PRO diagramming and vector drawing software extended with the "Android user interface" solution from the "Software Development" area of ConceptDraw Solution Park.
Editor system icons
Editor system icons, wrap text icon, vertical align top icon, vertical align center icon, vertical align bottom icon, publish icon, mode edit icon, mode comment  icon, merge type icon, insert photo icon, insert link icon, insert invitation icon, insert emoticon icon, insert drive file icon, insert comment icon, insert chart icon, functions icon, format underline icon, format textdirection r to l icon, format textdirection l to r icon, format strikethrough icon, format size icon, format quote icon, format paint icon, format list numbered icon, format list bulleted icon, format line spacing icon, format italic icon, format indent increase icon, format indent decrease icon, format color text icon, format color reset icon, format color fill icon, format clear icon, format bold icon, format align right icon, format align left icon, format align justify icon, format align center icon, border vertical icon, border top icon, border style icon, border right icon, border outer icon, border left icon, border inner icon, border horizontal icon, border color icon, border clear icon, border bottom icon, border all icon, attach money icon, attach file icon,

Flowchart design. Flowchart symbols, shapes, stencils and icons

A flowchart is a type of diagram that represents an algorithm, workflow or process, showing the steps as boxes of various kinds - flowchart symbols, and their order by connecting them with arrows.
Mavericks have always desired to stand apart and gorgeous design is the recipe for that. Any business graphic document will be more understandable if will use an expository color scheme for their parts. Flowchart design makes versatile presenting and explaining of the process and gives a fresh view that distinguishes it from black and white flowcharts on a paper. Workflow diagram or process flow diagrams become more understandable to ordinary people when it use minimum symbols and special signs.
The best design can be accomplished by starting from any of the suitable Conceptdraw examples. Pick one of them and begin to input proper text into each Flowchart symbols and shapes. Apply less colors in the document and don't turn into rainbow your diagram, three or four will be enough, also note that business process flowchart may not contain bright color hues. The next clue is to use identical colors for same flowchart shape types.
Business Process Modeling with ConceptDraw
Business Process Modeling with ConceptDraw "Business Process Diagrams" Solution

How to create a UML Diagram

ConceptDraw DIAGRAM extended with the Rapid UML solution is perfect for drawing professional UML diagrams.

How to Create a Pyramid Diagram

ConceptDraw Pyramid Diagram software allows drawing column charts using predesigned objects or drawing tools. In ConceptDraw Pyramid Diagram software you can find a complete set of column chart tools and objects.
HelpDesk

How to Connect a Live Object to a Text Data Source

You can easily create a visual dashboard using charts and graphics indicators from Live Objects libraries. Here is an instruction on how to connect a ConceptDraw live object with data source files in TXT format to visualize the actual values of your performance metrics.

mind map, mindmapping tools, mindmap, create book, create MS Word document, solution park Word Exchange

mind map, mindmapping tools, mindmap, create book, create MS Word document, solution park
This solution extends ConceptDraw MINDMAP software with the ability to quickly create the framework for a future article or book, fill the structure with ideas, and use it to produce an MS Word document with just a simple click of the mouse.

AWS icons 2.0

Architecture diagrams solution includes the icons Amazon notation suggests to be used when creating architecture diagrams describing your use of Amazon Web Services or Amazon Cloud Services.

Used for:create Web Application Architecture, architect infrastructure based on AWS® (Amazon Web Services), design application services based on AWS® (Amazon Web Services), design auto-scalable architecture, design for elastic compute cloud, illustrate whitepapers and presentations, create vector graphics files.

AWS Simple Icons for Architecture Diagrams

The AWS Architecture Diagrams solution includes icons, sample and templates for several Amazon Web Services products and resources, to be used when creating architecture diagrams. The icons are designed to be simple so that you can easily incorporate them in your diagrams and put them in your whitepapers, presentations, datasheets, posters or any technical material you like.

How to Build Cloud Computing Diagram Principal Cloud Manufacturing

The term “cloud” is very popular and widely used now, it is a server, data processing centre, or a network which lets to store the data and software, provides access to them, allows to run applications without installation and gives the possibility to process data hosted remotely via the Internet connection.
For documenting the Cloud Computing Architecture with a goal to facilitate the communication between stakeholders are successfully used the Cloud Computing Architecture diagrams. It is convenient and easy to draw various Cloud Computing Architecture diagrams in ConceptDraw DIAGRAM software with help of tools of the Cloud Computing Diagrams Solution from the Computer and Networks Area of ConceptDraw Solution Park.

android ui design, android gui, android ui design tool, android user interface Android User Interface‏

android ui design, android gui, android ui design tool, android user interface
The Android User Interface solution allows ConceptDraw DIAGRAM act as an Android UI design tool. Libraries and templates contain a variety of Android GUI elements to help users create images based on Android UI design.

HR Flowchart Symbols

A comprehensive selection of predesigned vector stencils libraries allow you to create eye-catching infographics relating to any human resource management process. Also included are standardized hr flowchart symbols, meaning your diagrams will be relevant and understood by all business associates.

Diagramming software for Amazon Web Service diagrams, charts and schemes

Professional software: visualize general system architecture, AWS diagrams are part of architecturing tools provided with ConceptDraw Solution Park.

Android UI Design

The Android operating system is one of the most popular platforms today. It was developed and now used on smartphones, tablets, netbooks, smartbooks, and many other electronic devices, and combines the reliability, flexibility and ease of use.
So, millions of people face daily with Android operating system on their devices, and thus one of important things for the developers of Android applications is developing of convenient and attractive Android UI design. ConceptDraw DIAGRAM diagramming and vector drawing software extended with Android User Interface Solution from the Software Development Area will help you in this.

ERD Symbols and Meanings

Crow's foot notation is used in Barker's Notation, Structured Systems Analysis and Design Method (SSADM) and information engineering. Crow's foot diagrams represent entities as boxes, and relationships as lines between the boxes. Different shapes at the ends of these lines represent the cardinality of the relationship.
The Chen's ERD notation is still used and is considered to present a more detailed way of representing entities and relationships.
To create an ERD, software engineers mainly turn to dedicated drawing software, which contain the full notation resources for their specific database design - ERD symbols and meanings. CS Odessa has released an all-inclusive Entity-Relationship Diagram (ERD) solution for their powerful drawing program, ConceptDraw DIAGRAM.
How to Build an Entity Relationship Diagram (ERD)