The vector stencils library "Pipes 2" contains 48 symbols of pipes. Use it for drawing plumbing and piping building plans, schematic diagrams, blueprints, or technical drawings of waste water disposal systems, hot and cold water supply systems in the ConceptDraw PRO diagramming and vector drawing software extended with the Plumbing and Piping Plans solution from the Building Plans area of ConceptDraw Solution Park.
Crossing
Junction
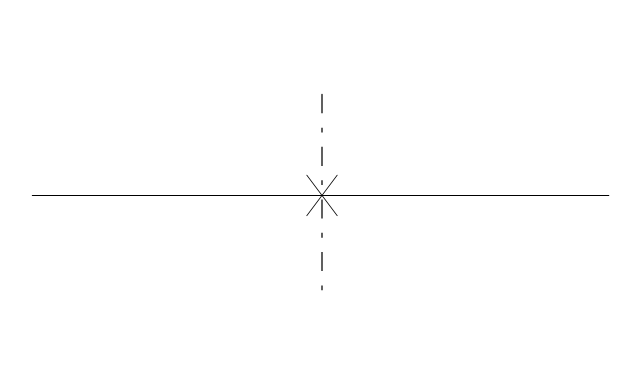
Basic support
Guide 1
Guide 2
Guide 3
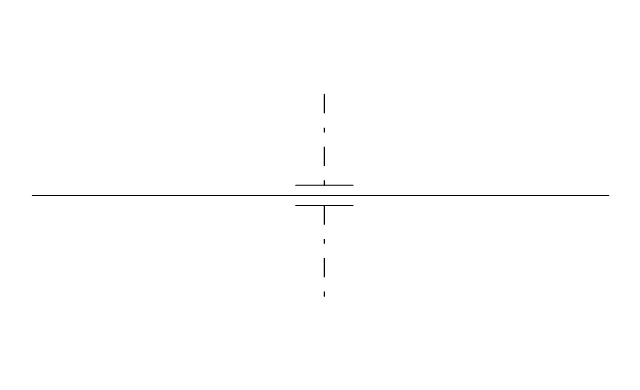
Stopper
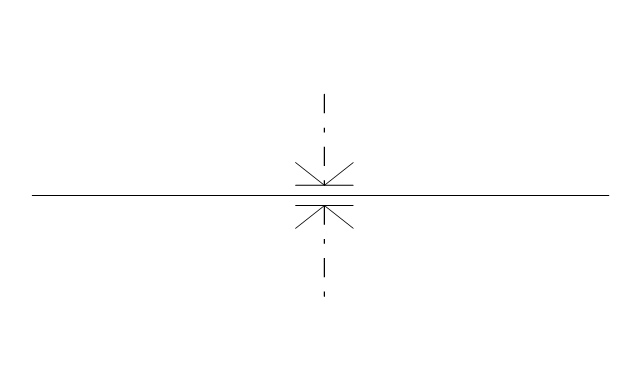
Anchor
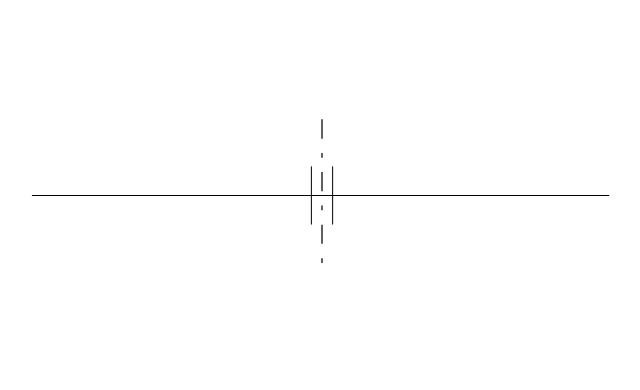
Support / anchor
Hunger
Cross
Double branch

Jacketed
Sleeved

Sleeve joint

Expansion sleeve joint

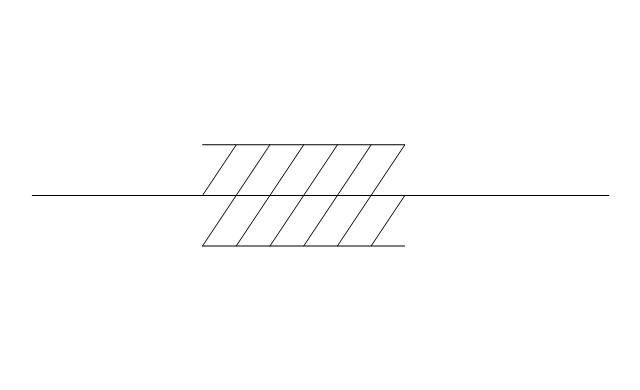
Lagged
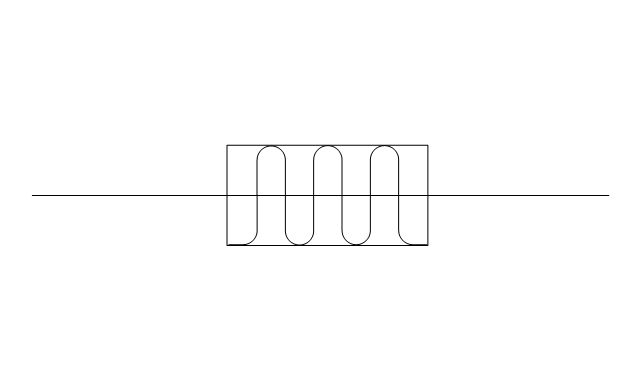
Bellows
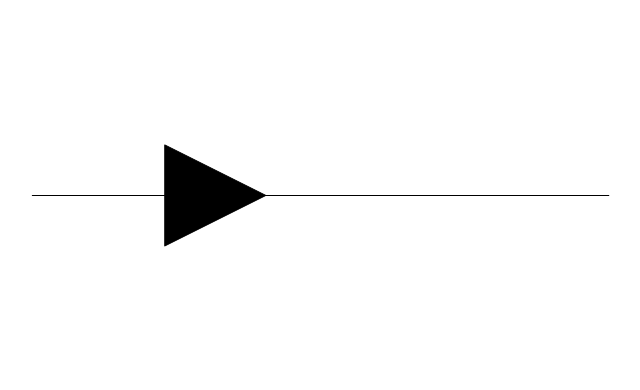
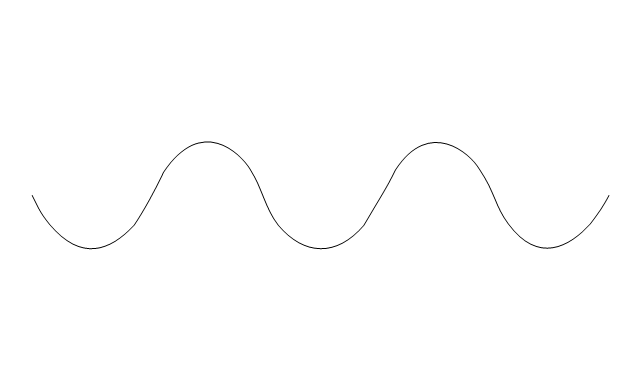
Flow indication
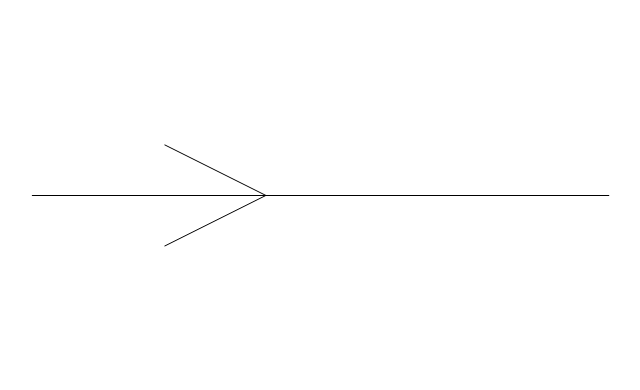
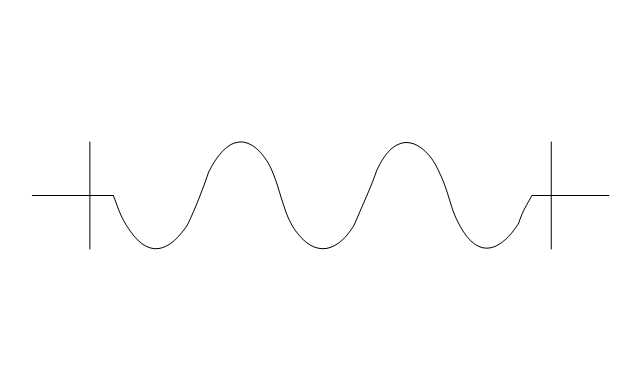
Flow indication 2
Reducer
Reducer,arrow
Pipe bore change
Flexibility provision
Sleeve extension

Flow restrictor
Elbow 45

Elbow 90

Heated or cooled

Pneumatic line

Signal line

Electric line
Hydraulic line

Capillary line
Internal connection
Route radiation
Mechanical linkage

Electrical device
Vibratory device
Weight device
Spray device
Rotary motion
Stirring / fan
Access points

Trap

Expansion loop
Flexible hose
Flexible hose, flanged
Software development with ConceptDraw DIAGRAM

The vector stencils library "Pipes 2" contains 48 symbols of pipes. Use it for drawing plumbing and piping building plans, schematic diagrams, blueprints, or technical drawings of waste water disposal systems, hot and cold water supply systems in the ConceptDraw PRO diagramming and vector drawing software extended with the Plumbing and Piping Plans solution from the Building Plans area of ConceptDraw Solution Park.
Crossing
Junction
Basic support
Guide 1
Guide 2
Guide 3
Stopper
Anchor
Support / anchor
Hunger
Cross
Double branch
Jacketed
Sleeved
Sleeve joint
Expansion sleeve joint
Lagged
Bellows
Flow indication
Flow indication 2
Reducer
Reducer,arrow
Pipe bore change
Flexibility provision
Sleeve extension
Flow restrictor
Elbow 45
Elbow 90
Heated or cooled
Pneumatic line
Signal line
Electric line
Hydraulic line
Capillary line
Internal connection
Route radiation
Mechanical linkage
Electrical device
Vibratory device
Weight device
Spray device
Rotary motion
Stirring / fan
Access points
Trap
Expansion loop
Flexible hose
Flexible hose, flanged
This Venn diagram sample depicts the path to sustainable development.
"Sustainable development is an organizing principle for human life on a finite planet. It posits a desirable future state for human societies in which living conditions and resource-use meet human needs without undermining the sustainability of natural systems and the environment, so that future generations may also have their needs met.
Sustainable development ties together concern for the carrying capacity of natural systems with the social and economic challenges faced by humanity. As early as the 1970s, 'sustainability' was employed to describe an economy "in equilibrium with basic ecological support systems." Scientists in many fields have highlighted The Limits to Growth, and economists have presented alternatives, for example a 'steady state economy', to address concerns over the impacts of expanding human development on the planet." [Sustainable development. Wikipedia]
The Venn diagram example "Path to sustainable development" was created using the ConceptDraw PRO diagramming and vector drawing software extended with the Venn Diagrams solution from the area "What is a Diagram" of ConceptDraw Solution Park.
Venn diagram

 Basic Diagramming
This solution extends ConceptDraw DIAGRAM software with the specific tools you need to easily draw flowcharts, block diagrams, histograms, pie charts, divided bar diagrams, line graphs, circular arrows diagrams, Venn diagrams, bubble diagrams and concept maps
The vector stencils library "Pipes 2" contains 48 symbols of pipes. Use it for drawing plumbing and piping building plans, schematic diagrams, blueprints, or technical drawings of waste water disposal systems, hot and cold water supply systems in the ConceptDraw PRO diagramming and vector drawing software extended with the Plumbing and Piping Plans solution from the Building Plans area of ConceptDraw Solution Park.
Crossing
Junction
Basic support
Guide 1
Guide 2
Guide 3
Stopper
Anchor
Support / anchor
Hunger
Cross
Double branch
Jacketed
Sleeved
Sleeve joint
Expansion sleeve joint
Lagged
Bellows
Flow indication
Flow indication 2
Reducer
Reducer,arrow
Pipe bore change
Flexibility provision
Sleeve extension
Flow restrictor
Elbow 45
Elbow 90
Heated or cooled
Pneumatic line
Signal line
Electric line
Hydraulic line
Capillary line
Internal connection
Route radiation
Mechanical linkage
Electrical device
Vibratory device
Weight device
Spray device
Rotary motion
Stirring / fan
Access points
Trap
Expansion loop
Flexible hose
Flexible hose, flanged
Internet solutions with ConceptDraw DIAGRAM

 Seven Basic Tools of Quality
Manage quality control in the workplace, using fishbone diagrams, flowcharts, Pareto charts and histograms, provided by the Seven Basic Tools of Quality solution.
A five level pyramid model of different types of Information Systems based on the information processing requirement of different levels in the organization. The first level represents transaction processing systems to process basic data. The second level represents office support systems to process information in office. The third level represents management information systems to process information by managers. The fourth level represents decision support systems to process explicit knowledge. The fifth level represents executive information systems to process tacit knowledge.
"A Computer(-Based) Information System is essentially an IS using computer technology to carry out some or all of its planned tasks. The basic components of computer based information system are:
(1) Hardware - these are the devices like the monitor, processor, printer and keyboard, all of which work together to accept, process, show data and information.
(2) Software - are the programs that allow the hardware to process the data.
(3) Databases - are the gathering of associated files or tables containing related data.
(4) Networks - are a connecting system that allows diverse computers to distribute resources.
(5) Procedures - are the commands for combining the components above to process information and produce the preferred output.
The first four components (hardware, software, database and network) make up what is known as the information technology platform. Information technology workers could then use these components to create information systems that watch over safety measures, risk and the management of data. These actions are known as information technology services." [Information systems. Wikipedia]
This pyramid diagram was redesigned using the ConceptDraw PRO diagramming and vector drawing software from Wikimedia Commons file Five-Level-Pyramid-model.png. [commons.wikimedia.org/ wiki/ File:Five-Level-Pyramid-model.png]
This file is licensed under the Creative Commons Attribution 3.0 Unported license. [creativecommons.org/ licenses/ by/ 3.0/ deed.en]
The triangle chart example "Information systems types" is included in the Pyramid Diagrams solution from the Marketing area of ConceptDraw Solution Park.
Pyramid diagram

In searching of alternative to MS Visio for MAC and PC with ConceptDraw DIAGRAM

- Basic Flowchart Symbols | How to Support Your Mind Map with ...
- 5 level pyramid model diagram of information systems types ...
- Basic Flowchart Symbols and Meaning | How to Create Flowchart ...
- Support / anchor
- Interior Design Piping Plan - Design Elements | Pipes 2 - Vector ...
- Design elements - Pipes (part 2)
- Workflow Diagram Examples | Workflow Diagrams | Flow chart ...
- Basic Flowchart Symbols and Meaning | Audit Flowchart Symbols ...
- Pyramid Diagram | Pyramid Diagram | 4 Level pyramid model ...
- Reducer
- Venn Diagrams | Visual Presentations Made Easy with ...
- Types of Flowchart - Overview | Basic Workflow Examples | Workflow ...
- Pyramid Diagram | 5 level pyramid model diagram of information ...
- Flowchart - Project management life cycle | Basic Diagramming ...
- Pipes 2 - Vector stencils library
- Basic Diagramming | Computer and Networks Area | ConceptDraw ...
- Hydraulic Pipe Symbols
- Design elements - HVAC control equipment | Process Flowchart ...
- Basic Flowchart Symbols and Meaning | Flowchart design ...
- Pipes