This picture bar graph sample shows the computer and Internet use at home from 1984 to 2014. It was designed using data from website of the United States Census Bureau (USCB).
[census.gov/ content/ dam/ Census/ library/ visualizations/ 2016/ comm/ digital_ nation.png]
"Home automation is the residential extension of building automation and involves the control and automation of lighting, heating, ventilation, air conditioning (HVAC), appliances, and security. Modern systems generally consist of switches and sensors connected to a central hub sometimes called a "gateway" from which the system is controlled with a user interface that is interacted either with a wall-mounted terminal, mobile phone software, tablet computer or a web interface." [Home automation. Wikipedia]
The pictorial chart example "Computer and Internet use at home over time" was created using the ConceptDraw PRO diagramming and vector drawing software extended with the Picture Graphs solution from the Graphs and Charts area of ConceptDraw Solution Park.
Image chart

Cause and Effect Diagrams

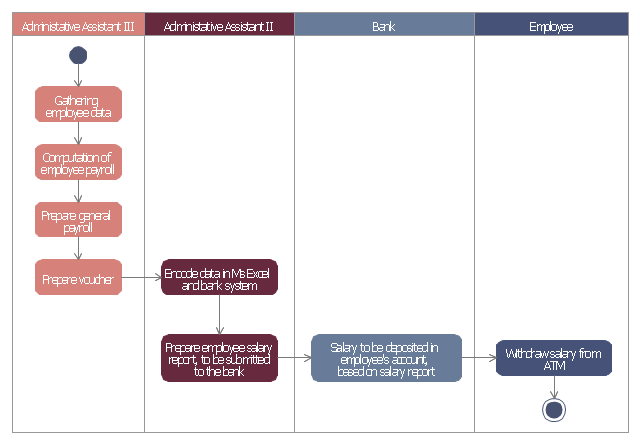
This example of automated payroll management system UML activity diagram was created on the base of figure on the webpage "Automated payroll management system" from ethelmandane.wikispaces.com.
"In the Philippines and in other foreign countries the government has a trend to embrace automation for process efficiency. One of the processes that are being automated is the payroll process. Payroll is the total amount required to pay workers and employees during a week, month or other period.
One of the government offices that desires to automate their payroll system is the NSO Camarines Sur which is located 2nd Floor MMCN Building, Panganiban Avenue, Naga City. The National Statistics Office (NSO) envisions to be recognized as a world-class provider of statistical and civil registration products and services and lives with its mission to produces and provides quality statistical and civil registration products and services. ...
The project seeks to create an Information System Plan for an Automated Payroll Management System. ...
The creation of the Information System Plan will benefit the accounting section of the organization. Specifically it is significant to:
1. Administrative Assistants. It will help to lessen time and effort in preparing and computing the salary of the employee.
2. NSO. It will help the organization to be more productive and efficient."
[ethelmandane.wikispaces.com/ ]
This file is licensed under a Creative Commons Attribution Share-Alike 3.0 License. [creativecommons.org/ licenses/ by-sa/ 3.0/ ]
This UML activity diagram example modeling the automated payroll management system using automated teller machine (ATM) was created using the ConceptDraw PRO diagramming and vector drawing software extended with the ATM UML Diagrams solution from the Software Development area of ConceptDraw Solution Park.
UML activity diagram of automated payroll management system using ATM
Workflow Diagram Examples

Basic Flowchart Symbols and Meaning


Software development with ConceptDraw PRO

Best Program to Make Workflow Diagrams

Software Diagrams

Drawing Workflow Diagrams

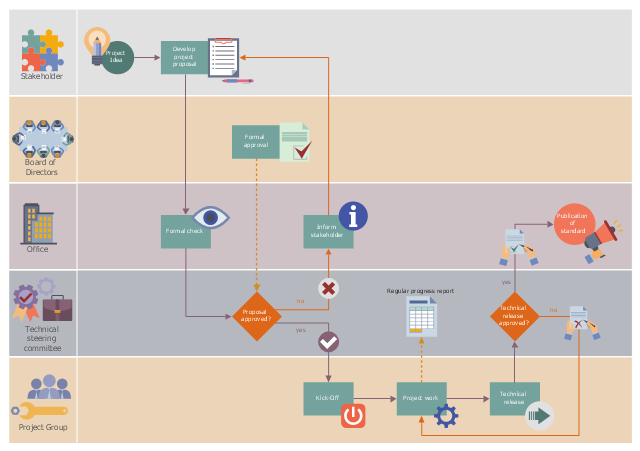
This workflow diagram example was designed on the base of the Wikimedia Commons file: ASAM e.V. flowchart.png.
"Life cycle of an ASAM standard." [commons.wikimedia.org/ wiki/ File:ASAM_ e.V._ flowchart.png]
This file is licensed under the Creative Commons Attribution-Share Alike 3.0 Unported license. [creativecommons.org/ licenses/ by-sa/ 3.0/ deed.en]
"Association for Standardization of Automation and Measuring Systems or ASAM is an incorporated association under German law. Its members are primarily international car manufacturers, suppliers and engineering service providers from the automotive industry. The association coordinates the development of technical standards, which are developed by working groups composed of experts from its member companies. ASAM pursues the vision that the tools of a development process chain can be freely interconnected and allow a seamless exchange of data. The standards define protocols, data models, file formats and application programming interfaces (APIs) for the use in the development and testing of automotive electronic control units." [Association for Standardisation of Automation and Measuring Systems. Wikipedia]
The workflow diagram example "Life cycle of an ASAM standard" was created using ConceptDraw PRO software extended with the Business Process Workflow Diagrams solution from the Business Processes area of ConceptDraw Solution Park.
Workflow diagram
FSM — Finite-state Machine

Bank System

"HVAC (stands for Heating, Ventilation and Air Conditioning) is a control system that applies regulation to a heating and/ or air conditioning system. Usually a sensing device is used to compare the actual state (e.g., temperature) with a target state. Then the control system draws a conclusion what action has to be taken (e.g., start the blower).
More complex HVAC systems can interface to Building Automation System (BAS) to allow the building owners to have more control over the heating or cooling units. The building owner can monitor the system and respond to alarms generated by the system from local or remote locations." [HVAC control system. Wikipedia]
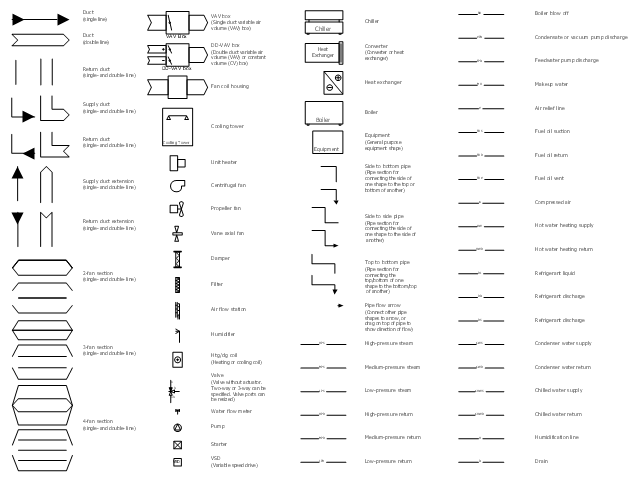
The vector stencils library "HVAC control equipment" contains 48 symbols of heating, ventilation, air conditioning, refrigeration and automated building control equipment.
Use the design elements library HVAC control equipment to draw HVAC plans, schematic diagrams of heating, ventilation, air conditioning, refrigeration and automated building control systems, environmental control design building plans and equipment layouts using the ConceptDraw PRO diagramming and vector drawing software.
The shapes library HVAC control equipment is contained in the HVAC Plans solution from the Building Plans area of ConceptDraw Solution Park.
More complex HVAC systems can interface to Building Automation System (BAS) to allow the building owners to have more control over the heating or cooling units. The building owner can monitor the system and respond to alarms generated by the system from local or remote locations." [HVAC control system. Wikipedia]
The vector stencils library "HVAC control equipment" contains 48 symbols of heating, ventilation, air conditioning, refrigeration and automated building control equipment.
Use the design elements library HVAC control equipment to draw HVAC plans, schematic diagrams of heating, ventilation, air conditioning, refrigeration and automated building control systems, environmental control design building plans and equipment layouts using the ConceptDraw PRO diagramming and vector drawing software.
The shapes library HVAC control equipment is contained in the HVAC Plans solution from the Building Plans area of ConceptDraw Solution Park.
HVAC control equipment symbols
Jacobson Use Cases Diagram

- Diagram Of Office Automation System
- Models Of Office Automation System
- Bank Automation Systems
- Payroll Automation Er Diagram
- Office Automation System Diagram
- Office Automation Equipment Diagram
- Canteen Automation System Er Diagram
- Diagram Of Process Control Instrument In Automation
- Flowchart Example Of Sales Force Automation
- Automation Electrical Symbol Pdf
- Automation Engineers Symbol
- Ivr Automation
- Library Automation Dfd
- Workflow Automation Software Open Source
- Information Flow Chart On Automation Of Library
- Process Flowchart | Canteen Automation System Flowchart
- Mechanical Automation Symbols
- ERD Symbols and Meanings | Automation Marketing Notification Flow
- Uml Diagram Of Bank Automation System
- Use Case Diagram For Restaurant Automation System