This site uses cookies. By continuing to browse the ConceptDraw site you are agreeing to our Use of Site Cookies.

UML Use Case Diagram Example Registration System

This sample was created in ConceptDraw DIAGRAM diagramming and vector drawing software using the UML Use Case Diagram library of the Rapid UML Solution from the Software Development area of ConceptDraw Solution Park. This sample shows the types of user’s interactions with the system and is used at the registration and working with the database system.

Campus Area Networks (CAN). Computer and Network Examples

Campus Area Network (CAN) is a computer network which provides wireless access to the Internet or LAN for the users located in two or more buildings on the limited geographical area, or in the open space surrounding these buildings. Campus Area Network is usually set in campus of a university or college, but the same kind of planning and design can be applied for other purposes, for enterprises, office buildings, military bases, industrial complexes, public places like supermarkets, entertainment centers, etc. Another form of temporary CAN can exist during some special events such as rallies, music festivals. The elementary Campus Area Network can also arise spontaneously, due to the distance of spread the radio signals from the access points that are not limited by buildings walls. It is also sensible to have additional access points for the larger and more complex CANs, located at specially places chosen for serving clients. Design easy diagrams and schemes for the Campus Area Networks with Computer Network Diagrams solution for ConceptDraw DIAGRAM.

Entity Relationship Diagram Software Engineering

Entity Relationship Diagram (aka ER Diagram, E-R Diagram, ERD) is a time-tested and widespread software development and software engineering method for data modeling, illustrating the logical structure of databases and system design. For ERDs construction are used three basic elements: entities, attributes, and relationships. Chen's notation for ERD supposes the use of rectangles (boxes) to represent entities and diamonds to depict relationships between first-class objects. This notation is popular when creating conceptual data models of information systems. Another standardized notation for ER diagrams is Crow's foot notation. ConceptDraw DIAGRAM as a powerful Entity Relationship Diagram software engineering provides the tools of Entity-Relationship Diagram (ERD) solution from Software Development area of ConceptDraw Solution Park for instantly describing databases using ERDs of Crow’s Foot and Chen’s notations. Use the predesigned vector elements for both these notations from 2 libraries included to Entity-Relationship Diagram (ERD) solution.

UML Use Case Diagram Example Social Networking Sites Project

UML Diagrams Social Networking Sites Project. This sample was created in ConceptDraw DIAGRAM diagramming and vector drawing software using the UML Use Case Diagram library of the Rapid UML Solution from the Software Development area of ConceptDraw Solution Park. This sample shows the Facebook Socio-health system and is used at the projection and creating of the social networking sites.

Local area network (LAN). Computer and Network Examples

Local Area Network (LAN) is a network which consists of computers and peripheral devices connected each other and to the local domain server, and covers a little territory or small number of buildings, such as home, school, laboratory, office, etc. LAN serves for few hundreds of users. It includes many cables and wires, and demands to design previously a Network diagram. All local area network devices can use the shared printers and disk storage. ConceptDraw DIAGRAM is a perfect network diagramming software with examples of LAN Diagrams, templates and predesigned vector objects. ConceptDraw DIAGRAM is the ideal choice for network engineers and network designers who need to draw fast and easy Local Area Network Diagrams, for IT specialists, developers and other IT professionals which need to visualize the communication schemes of LAN and visually document the LAN's physical structure and arrangement in houses, offices and other buildings. Ready-to-use vector objects from Computer Network Diagrams solution will help you design LAN diagrams in minutes.
How to Draw a Computer Network

Examples of Flowcharts, Org Charts and More

ConceptDraw DIAGRAM covers a broad spectrum of business graphics categories and offers at ConceptDraw STORE enormous online collection of pictorial examples and samples for different thematics and application areas. It is a plentiful source of inspiration and wonderful examples of professionally designed diagrams, flowcharts, UML diagrams, organizational charts, databases, ERDs, network diagrams, business charts, different thematic charts, schematics, infographics and plans developed specially for knowledge workers, engineers, managers, businessmen, marketing specialists, analytics, scientists, students, professors, journalists and also for a large number of other people that every day use various diagrams and drawings in their work and life activity. Each of these examples is a real art, all they are well thought-out and designed without efforts with help of powerful tools of ConceptDraw DIAGRAM software. ConceptDraw examples display all variety of tasks, possibilities and results that ConceptDraw Product Line lets achieve fast and easy. 
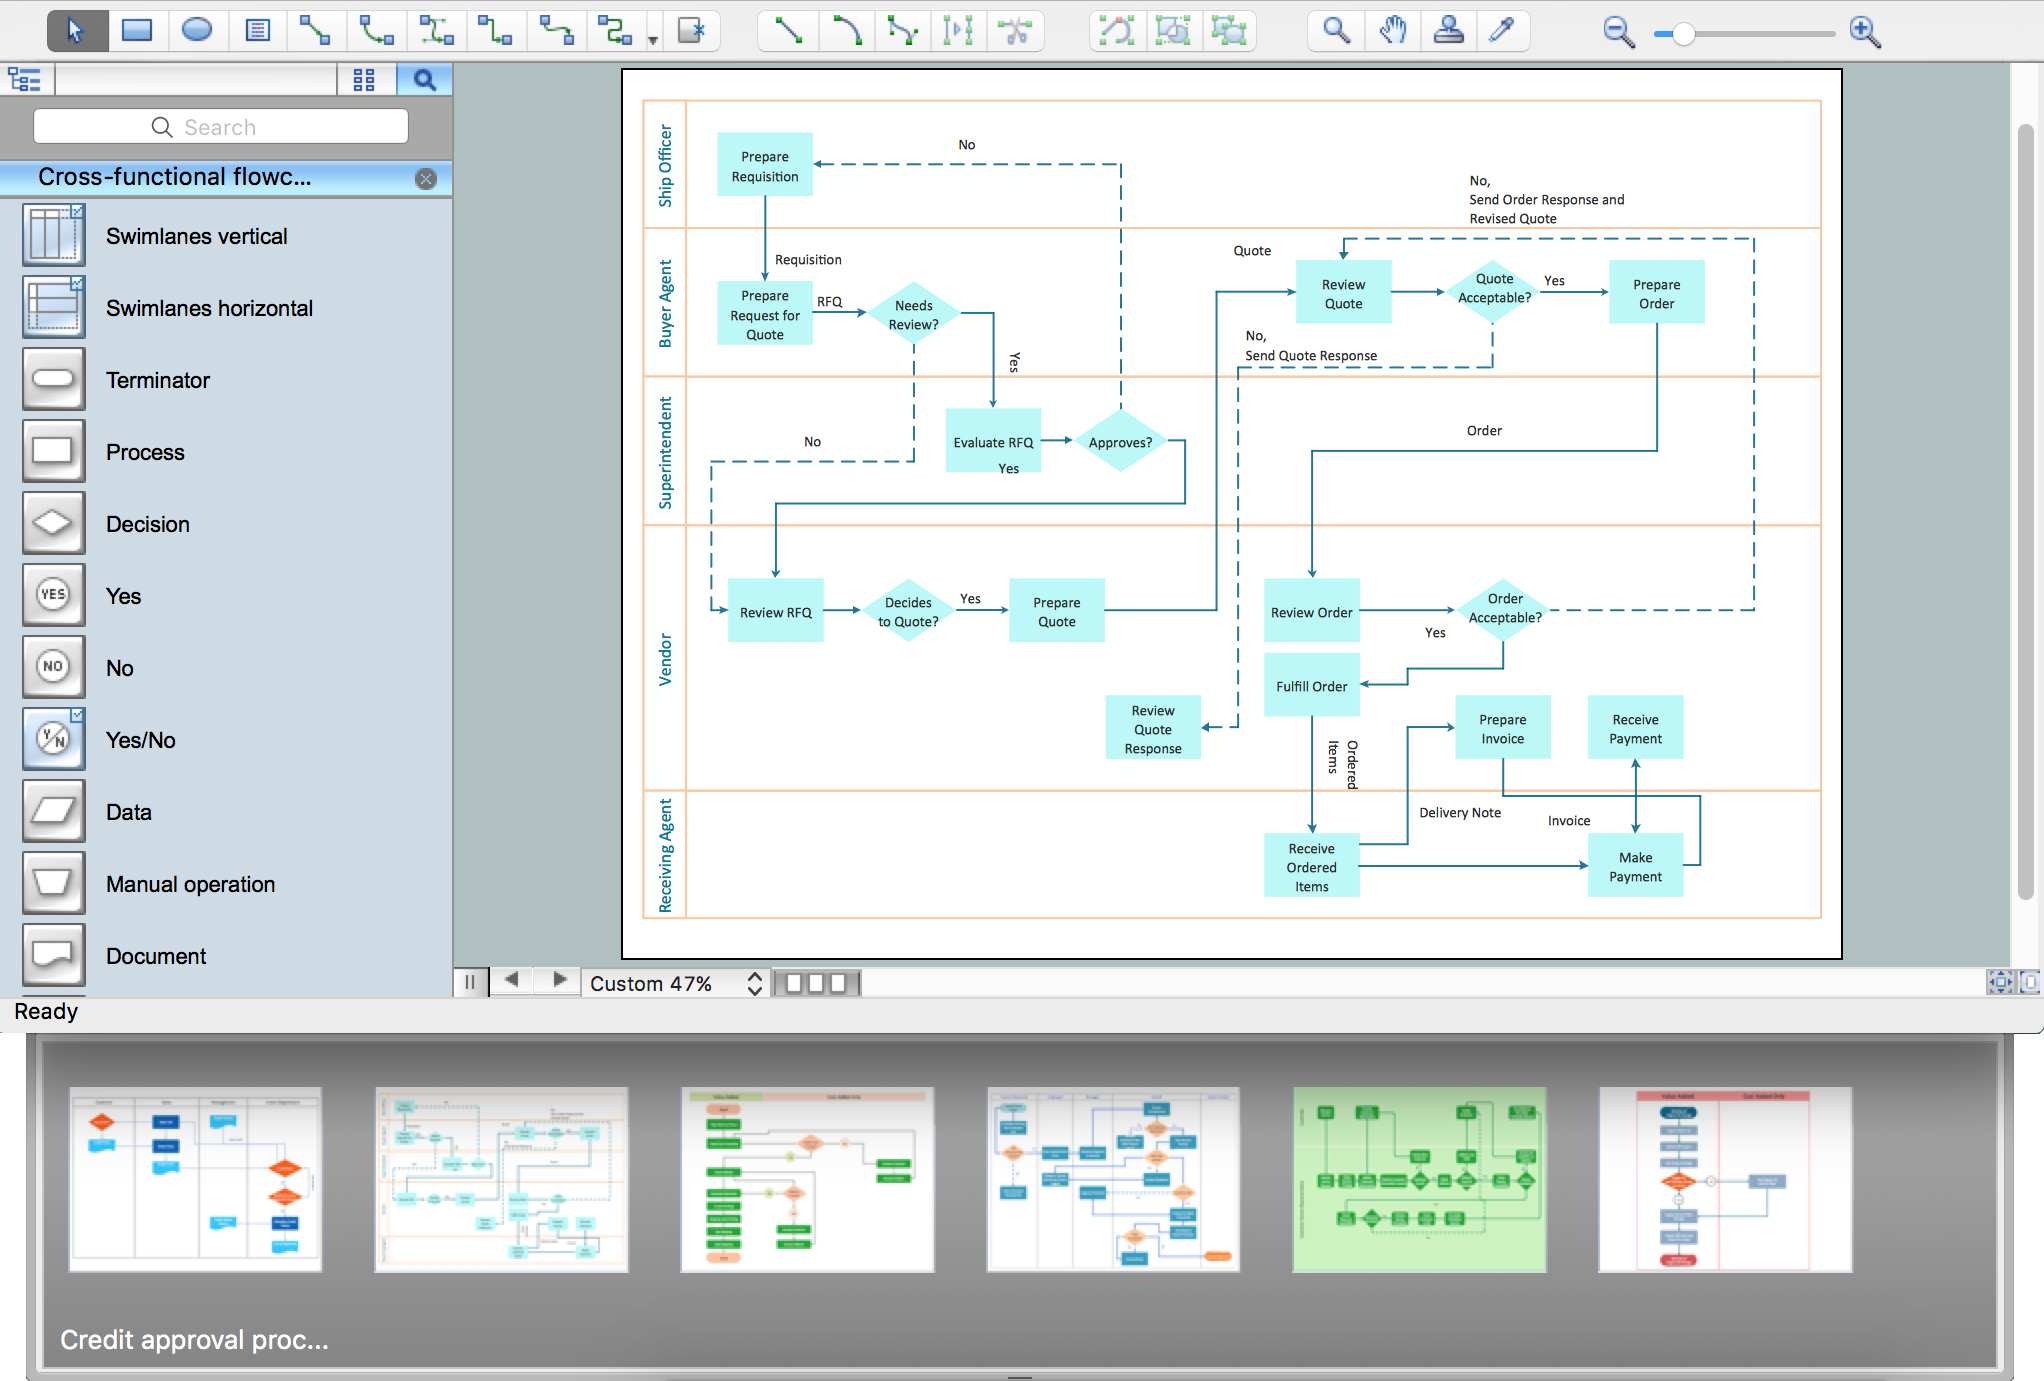
ConceptDraw is one of the best Visio alternatives for Mac. It open all Visio formats like.vsdx,.vss,.vdx files and allows you to export files to Visio formats.
What is ConceptDraw OFFICE

Process Flowchart

The main reason of using Process Flowchart or PFD is to show relations between major parts of the system. Process Flowcharts are used in process engineering and chemical industry where there is a requirement of depicting relationships between major components only and not include minor parts. Process Flowcharts for single unit or multiple units differ in their structure and implementation. ConceptDraw DIAGRAM is Professional business process mapping software for making Process flowcharts, Process flow diagram, Workflow diagram, flowcharts and technical illustrations for business documents and also comprehensive visio for mac application. Easier define and document basic work and data flows, financial, production and quality management processes to increase efficiency of your business with ConcepDraw DIAGRAM. Business process mapping software with Flowchart Maker ConceptDraw DIAGRAM includes extensive drawing tools, rich examples and templates, process flowchart symbols and shape libraries, smart connectors that allow you create the flowcharts of complex processes, process flow diagrams, procedures and information exchange. Process Flowchart Solution is project management workflow tools which is part ConceptDraw Project marketing project management software. Drawing charts, diagrams, and network layouts has long been the monopoly of Microsoft Visio, making Mac users to struggle when needing such visio alternative like visio for mac, it requires only to view features, make a minor edit to, or print a diagram or chart. Thankfully to MS Visio alternative like ConceptDraw DIAGRAM software, this is cross-platform charting and business process management tool, now visio alternative for making sort of visio diagram is not a problem anymore however many people still name it business process visio tools.
How To Create a Process Flow Chart (business process modelling techniques)

Export from ConceptDraw DIAGRAM Document to a Graphic File

Now it’s easy to share your visual documents with other people in a form most convenient for them. ConceptDraw DIAGRAM can save your drawings and diagrams in a number of highly useful formats, including graphic files. You can save your drawing as a.PNG,.JPG, or other graphic format file.
Export to a Graphic File

Fishbone Diagram Problem Solving

The Ishikawa diagram, Cause and Effect diagram, Fishbone diagram — all they are the names of one and the same visual method for working with causal connections. Originally invented by Kaoru Ishikawa to control the process quality, the Ishikawa diagram is well proven in other fields of management and personal scheduling, events planning, time management. It is a chart in the form of a fish, whose head is a problem, the fins are variants for its causes. To design easily the Fishbone diagram, you can use a special ConceptDraw DIAGRAM ector graphic and diagramming software which contains the powerful tools for Fishbone diagram problem solving offered by Fishbone Diagrams solution for the Management area of ConceptDraw Solution Park.

How to Create Flowcharts for an Accounting Information System

Accounting information is a system of interrelated processes which represent financial and accounting data, required for decision making. For representing the accounting processes in a visual and easy for perception form are constructed Accounting Flowcharts. For their creation are used special flowchart symbols, this makes Accounting flowcharts understandable for all users of accounting information system and helps them easy understand the sequence of steps involved to accounting processes. But how to create Flowcharts for an Accounting Information System fast and easy? Use of special design software is useful for this. ConceptDraw DIAGRAM software extended with Accounting Flowcharts solution is the best for creation accurate Accounting Flowcharts, for documentation and visually communication on how accounting processes work, how each operation is done. Accounting Flowcharts solution is supplied with library of predesigned commonly used vector symbols, Accounting Flowchart templates and samples demonstrating receiving, purchasing, payment, and other accounting processes.