Process Engineering

Flow chart Example. Warehouse Flowchart


Example of DFD for Online Store (Data Flow Diagram) DFD Example


 Marketing Diagrams
Marketing Diagrams solution extends ConceptDraw PRO diagramming software with abundance of samples, templates and vector design elements intended for easy graphical visualization and drawing different types of Marketing diagrams and graphs, including Branding Strategies Diagram, Five Forces Model Diagram, Decision Tree Diagram, Puzzle Diagram, Step Diagram, Process Chart, Strategy Map, Funnel Diagram, Value Chain Diagram, Ladder of Customer Loyalty Diagram, Leaky Bucket Diagram, Promotional Mix Diagram, Service-Goods Continuum Diagram, Six Markets Model Diagram, Sources of Customer Satisfaction Diagram, etc. Analyze effectively the marketing activity of your company and apply the optimal marketing methods with ConceptDraw PRO software.
Bar Diagrams for Problem Solving. Create economics and financial bar charts with Bar Graphs Solution

Bar Diagrams for Problem Solving. Create manufacturing and economics bar charts with Bar Graphs Solution

This flow chart sample was drawn on the base on the illustration of the article "Climate change impact on China food security in 2050" from the website of Chinese Academy of Agricultural Sciences .
[caas.cn/ en/ newsroom/ research_ update/ 67347.shtml]
"Food security is a condition related to the ongoing availability of food. ...
According to the Food and Agriculture Organization (FAO), food security "exists when all people, at all times, have physical and economic access to sufficient, safe and nutritious food to meet their dietary needs and food preferences for an active and healthy life". ...
Extreme events, such as droughts and floods, are forecast to increase as climate change takes hold. Ranging from overnight floods to gradually worsening droughts, these will have a range of impacts on the agricultural sector. ...
According to the Climate & Development Knowledge Network report Managing Climate Extremes and Disasters in the Agriculture Sectors: Lessons from the IPCC SREX Report, the impacts will include changing productivity and livelihood patterns, economic losses, and impacts on infrastructure, markets and food security. Food security in future will be linked to our ability to adapt agricultural systems to extreme events." [Food security. Wikipedia]
The flowchart example "Food security assessment" was created using the ConceptDraw PRO diagramming and vector drawing software extended with the Flowcharts solution from the area "What is a Diagram" of ConceptDraw Solution Park.
Flowchart

Geo Map - Africa - Benin

Geo Map — USA — Montana

Geo Map - Canada - Manitoba

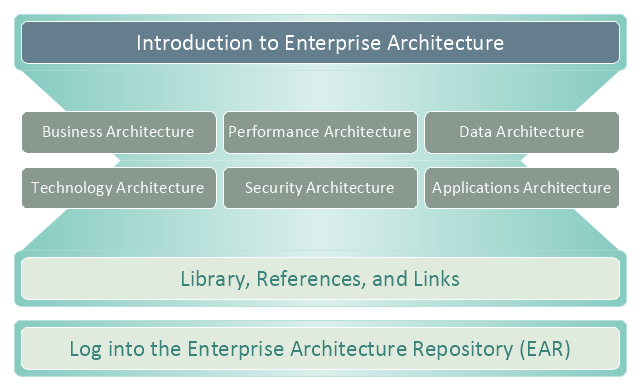
This enterprise architecture diagram sample was drawn on the base of the figure illustrating the webpage "Enterprise Architecture" from the United States Department of Agriculture (USDA) website.
"The USDA's Enterprise Architecture program strategically partners with all agencies to provide value to USDA's mission areas, business processes, and Information Technology (IT) capabilities.
Introduction.
The USDA Enterprise Architecture (EA) helps make sure information technology investments align with the mission and goals of the Department. It defines how information and technology should support USDA’s strategic goals and benefit the business.
Purpose.
The intent of the USDA Enterprise Architecture is to help make the information technology (IT) expenditures more effectively serve the mission and goals of the organization. Enterprise architecture defines how information and technology support USDA’s strategic planning to benefit our business. There are many ways to organize the information and diagrams that make up the architecture."
[ocio.usda.gov/ about-ocio/ governance-and-strategic-investment-gsi/ enterprise-architecture]
The enterprise architecture diagram example "USDA's Enterprise Architecture" was created using the ConceptDraw PRO diagramming and vector drawing software extended with the Enterprise Architecture Diagrams solution from the Management area of ConceptDraw Solution Park.
Enterprise architecture diagram
- Agriculture Flowchart Draw
- Process Of Agriculture With Diagram
- Flow chart Example. Warehouse Flowchart | Process Engineering ...
- Flowchart On Agriculture
- Agriculture Steps Flowchart
- Example Of How To Draw Diagram For The Agriculture In Business
- Agricultural Diagrams Simple For Drawing
- Flow Chart Showing Agriculture Practice
- Draw A Flow Chart To Present This New Agriculture Syste
- Packaging Material For Agriculture Produce
- Flow chart Example. Warehouse Flowchart | Process Engineering ...
- Diagram For Agriculture Sector
- Agriculture Sector Diagrams
- Solution Flow Charts In Agriculture
- Basic Flowchart Symbols and Meaning | Account Flowchart ...
- Bio Flowchart | Basic Flowchart Symbols and Meaning | Process ...
- Food security assessment - Flowchart | Flowcharts | Contoh ...
- Top iPad Business Process Diagrams Apps | Food security ...
- Work Flow Chart | Workflow Diagram Software | Types of Flowcharts ...
- Food security assessment - Flowchart | Accounting Flowcharts | How ...