Flowchart Marketing Process. Flowchart Examples

Network Topology Illustration

Diagramming Software for Design UML Collaboration Diagrams


Metropolitan area networks (MAN). Computer and Network Examples
. Computer and Network Examples")

Use the Best FlowChart Tool for the Job

Influence Diagram Software

 Quality Mind Map
This solution extends ConceptDraw MINDMAP software with Quality Management Mind Maps (Presentations, Meeting Agendas, Problem to be solved).
Best Flowcharts

This area chart sample shows the US federal prisoner population changes from 1914 to 2010.
"The Federal Bureau of Prisons (BOP) is a United States federal law enforcement agency. A subdivision of the U.S. Department of Justice, the Bureau is responsible for the administration of the federal prison system. The system also handles prisoners who committed acts considered felonies under the District of Columbia's law. The Bureau was established in 1930 to provide more progressive and humane care for federal inmates, to professionalize the prison service, and to ensure consistent and centralized administration of the 11 federal prisons in operation at the time.
According to its official web site, the Bureau consists of more than 116 institutions, six regional offices, its headquarters office in Washington, D.C., two staff training centers, and 22 community corrections offices, and is responsible for the custody and care of approximately 210,000 federal offenders. Approximately 82 percent of these inmates are confined in Bureau-operated correctional facilities or detention centers. The remainder are confined through agreements with state and local governments or through contracts with privately operated community corrections centers, detention centers, prisons, and juvenile facilities." [Federal Bureau of Prisons. Wikipedia]
This area graph sample was redesigned from the Wikimedia Commons file: Federal timeline US prisoners.gif. [commons.wikimedia.org/ wiki/ File:Federal_ timeline_ US_ prisoners.gif]
The area chart example "Federal timeline US prisoners" was created using the ConceptDraw PRO diagramming and vector drawing software extended with the Area Charts solution from the Graphs and Charts area of ConceptDraw Solution Park.
Area graph

Cross-Functional Flowchart


Flow Diagram

Bubble Chart
 Flowcharts
The Flowcharts solution for ConceptDraw PRO is a comprehensive set of examples and samples in several varied color themes for professionals that need to represent graphically a process. Solution value is added by the basic flow chart template and shapes' libraries of flowchart notation. ConceptDraw PRO flow chart creator lets one depict the processes of any complexity and length, as well as design the Flowchart either vertically or horizontally.
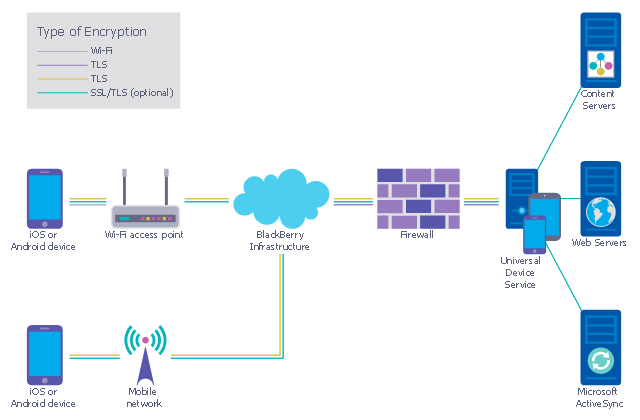
This example was designed on the base of the diagram from the "BYOD Guidance: BlackBerry Secure Work Space" on the website of the UK Communications Electronics Security Group (CESG).
"Secure Work Space (SWS) for iOS and Android is a containerisation, application-wrapping and secure connectivity option that delivers a higher level of control and security to iOS and Android devices, all managed through the BlackBerry Enterprise Service (BES) administration console.
Work space applications are secured and separated from personal applications and data. The work space applications include an integrated email, calendar, and contacts application, an enterprise-level secure browser, and a secure document viewing and editing application.
The work browser allows users to securely browse the organisation’s intranet and the Internet. If the device is lost or the employee leaves the organisation, you can chose to delete only corporate information or all information from the device.
...
Recommended network architecture
The walled garden architecture, shown below, aims to limit the impact of a compromise of an EUD and isolate high risk components from high value components where possible. The enterprise servers installed as part of SWS are high value resources that require suitable protection but are also high risk; they perform complex processing tasks that are more likely to contain exploitable vulnerabilities. These competing priorities make securely placing the servers into an existing network challenging, and organisations that wish to deviate from this architecture below should ensure they understand the risks of doing so."
[cesg.gov.uk/ guidance/ byod-guidance-blackberry-secure-work-space]
The cybersecurity diagram example "Recommended network architecture for BlackBerry SWS" was created using the ConceprDraw PRO software extended with the Network Security Diagrams solution from the Computer and Neworks area of ConceptDraw Solution Park.
Computer security diagram
- Draw A Functional Block Diagram Showing Administration And
- Block diagram - Six markets model | Visualize Stakeholder Analysis ...
- Sample Diagram Of Network And Explain
- How to Draw an Organization Chart | Organization Chart Templates ...
- Routers Block Diagram
- 3D Block diagram - Template | Basic Diagramming | Block Diagrams ...
- Block Diagram Of Wired Lan
- Block Diagram Creator | Star Network Topology | Storage area ...
- Block Diagrams Of Topologies
- Explain Block Diagram Of Lan
- Block Diagram Network Topology Bus
- Telecommunication Network Diagrams | Block Diagrams | Storage ...
- Block Diagram Topology
- Block diagram - Document management system architecture | PM ...
- Explain The Concept Of Bus Network Topology With A Block Diagram
- Block Diagram Creator | Block Diagram | IDEF0 standard with ...
- Networking Block Diagram Of Computer With Different Networking
- Block Diagrams | Active Directory Diagram | Examples of Flowcharts ...
- UML Block Diagram | Daisy Chain Network Topology | Star Network ...
- Block Diagrams Of Network Topologies