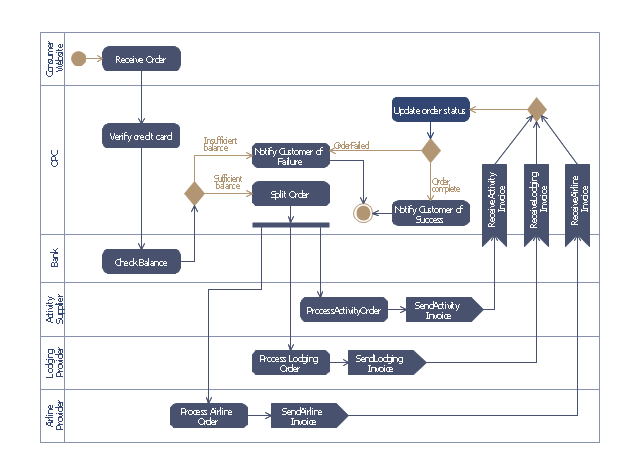
This purchase order processing UML activity diagram was created on the base of activity diagram from the software architecture documentation wiki of the Software Engineering Institute (SEI) of Carnegie Mellon University (CMU).
[wiki.sei.cmu.edu/ sad/ index.php/ Image:PurchaseOrderActivityDiagram.png]
"A purchase order (PO) is a commercial document and first official offer issued by a buyer to a seller, indicating types, quantities, and agreed prices for products or services. Acceptance of a purchase order by a seller forms a contract between the buyer and seller, so no contract exists until the purchase order is accepted. It is used to control the purchasing of products and services from external suppliers.
Creating a purchase order is typically the first step of the purchase to pay process in an ERP system." [Purchase order. Wikipedia]
This purchase order processing UML activity diagram example was created using the ConceptDraw PRO diagramming and vector drawing software extended with the ATM UML Diagrams solution from the Software Development area of ConceptDraw Solution Park.
UML activity diagram of purchase order processing
How to Create Presentation of Your Project Gantt Chart

Pyramid Diagram

Pyramid Diagram

Flowchart design. Flowchart symbols, shapes, stencils and icons


This value stream map example was redesigned from the Wikipedia file: ValueStreamMapParts.png.
[en.wikipedia.org/ wiki/ File:ValueStreamMapParts.png]
This file is licensed under the Creative Commons Attribution-Share Alike 3.0 Unported license. [creativecommons.org/ licenses/ by-sa/ 3.0/ deed.en]
"Value stream mapping (VSM) refers to the activity of developing a visual representation of the flow of processes, from start to finish, involved in delivering a desired outcome, service, or product (a “value stream”) that is valued by customers. In the context of government, a value stream could be the process of conducting an audit, completing a procurement, or hiring new agency staff. VSM can increase understanding of actual decision-making processes and identify sources of non-value-added time (e.g., documents waiting to be reviewed). The typical products of a 2-5 day VSM workshop are a map of the “current state” of targeted processes and a “future state” map of the desired process flow and an associated implementation plan for future process improvement activities." [en.wikibooks.org/ wiki/ Business_ Analysis_ Guidebook/ LEAN]
The VSM diagram example "Value stream map parts" was created using the ConceptDraw PRO diagramming and vector drawing software extended with the Value Stream Mapping solution from the Quality area of ConceptDraw Solution Park.
Value stream mapping

Typography Infographic Examples

Process Flowchart


Process Flow Chart Examples

- UML Activity Diagram | Design elements - UML use case diagrams ...
- Global Payment Solutions | UML activity diagram - Payment process ...
- Png Pay
- Purchase order processing UML activity diagram | Order processing ...
- Pie Charts | Purchase order processing UML activity diagram ...
- Germany Map | UML Activity Diagram | Bar Diagrams for Problem ...
- Purchase order processing UML activity diagram | Order process ...
- Cheque Png
- Vehicular ad-hoc network | UML activity diagram - Alarm trigger ...
- UML Activity Diagram | Interior Design Office Layout Plan Design ...