Cross-Functional Flowchart


 Organizational Charts
Organizational Charts solution extends ConceptDraw PRO software with samples, templates and library of vector stencils for drawing the org charts.
Process Flowchart


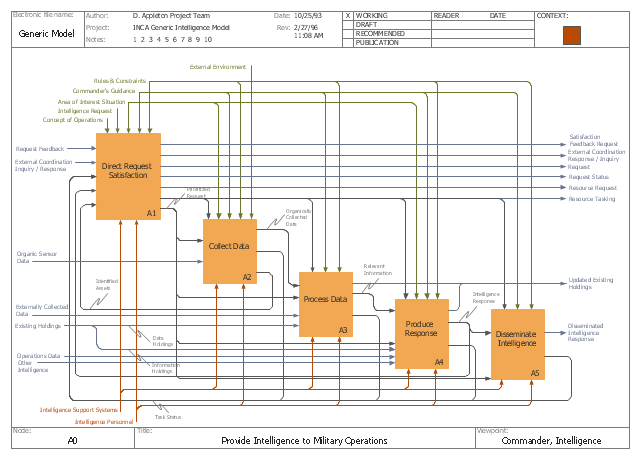
This IDEF0 diagram example was redesigned from the Wikimedia Commons file: C4ISR Architecture Framework, Example Activity Diagram in IDEF0 Format.jpg. [commons.wikimedia.org/ wiki/ File:C4ISR_ Architecture_ Framework,_ Example_ Activity_ Diagram_ in_ IDEF0_ Format.jpg]
"... the C4ISR concept of Command, Control, Communications, Computers, Intelligence, Surveillance and Reconnaissance ..." [en.wikipedia.org/ wiki/ C4ISR]
"The C4ISR Architectural Framework (C4ISR AF) is now known as DoDAF, is a reference model developed by the US Department of Defense in the 1990s." [commons.wikimedia.org/ wiki/ Category:C4ISR_ Architecture_ Framework]
"The Department of Defense Architecture Framework (DoDAF) is an architecture framework for the United States Department of Defense (DoD) that provides visualization infrastructure for specific stakeholders concerns through viewpoints organized by various views. These views are artifacts for visualizing, understanding, and assimilating the broad scope and complexities of an architecture description through tabular, structural, behavioral, ontological, pictorial, temporal, graphical, probabilistic, or alternative conceptual means.
This Architecture Framework is especially suited to large systems with complex integration and interoperability challenges, and it is apparently unique in its employment of "operational views". These views offer overview and details aimed to specific stakeholders within their domain and in interaction with other domains in which the system will operate." [en.wikipedia.org/ wiki/ Department_ of_ Defense_ Architecture_ Framework]
The example "C4ISR architecture framework - IDEF0 activity diagram" was created using the ConceptDraw PRO diagramming and vector drawing software extended with the solution "IDEF Business Process Diagrams" from the area "Business Processes" of ConceptDraw Solution Park.
IDEF0 business process diagram
Used Solutions
"A swim lane (or swimlane) is a visual element used in process flow diagrams, or flowcharts, that visually distinguishes responsibilities for sub-processes of a business process. Swim lanes may be arranged either horizontally or vertically. In the accompanying example, the swimlanes are named Customer, Sales, Contracts, Legal, and Fulfillment, and are arranged vertically. ...
When used to diagram a business process that involves more than one department, swimlanes often serve to clarify not only the steps and who is responsible for each one, but also how delays, mistakes or cheating are most likely to occur.
Many process modeling methodologies utilize the concept of swimlanes, as a mechanism to organize activities into separate visual categories in order to illustrate different functional capabilities or responsibilities (organisational roles). Swimlanes are used in Business Process Modeling Notation (BPMN) and Unified Modeling Language activity diagram modeling methodologies." [Swim lane. Wikipedia]
The template "UML activity diagram (swimlanes)" for the ConceptDraw PRO diagramming and vector drawing software is included in the Rapid UML solution from the Software Development area of ConceptDraw Solution Park.
www.conceptdraw.com/ solution-park/ software-uml
UML activity diagram (swimlanes)
-uml-activity-diagram-(swimlanes)---template.png--diagram-flowchart-example.png)
Basic Flowchart Symbols and Meaning


Flow chart Example. Warehouse Flowchart


Organizational Structure Diagram Software


Data modeling with ConceptDraw PRO

Critical Path Method in ConceptDraw PROJECT

 Fishbone Diagram
Fishbone Diagrams solution extends ConceptDraw PRO software with templates, samples and library of vector stencils for drawing the Ishikawa diagrams for cause and effect analysis.
 Entity-Relationship Diagram (ERD)
Entity-Relationship Diagram (ERD) solution extends ConceptDraw PRO software with templates, samples and libraries of vector stencils from drawing the ER-diagrams by Chen's and crow’s foot notations.
 Data Flow Diagrams (DFD)
Data Flow Diagrams solution extends ConceptDraw PRO software with templates, samples and libraries of vector stencils for drawing the data flow diagrams (DFD).
 Network Layout Floor Plans
Network Layout Floor Plans solution extends ConceptDraw PRO software functionality with powerful tools for quick and efficient documentation the network equipment and displaying its location on the professionally designed Network Layout Floor Plans. Never before creation of Network Layout Floor Plans, Network Communication Plans, Network Topologies Plans and Network Topology Maps was not so easy, convenient and fast as with predesigned templates, samples, examples and comprehensive set of vector design elements included to the Network Layout Floor Plans solution. All listed types of plans will be a good support for the future correct cabling and installation of network equipment.
Linux Audit Flowchart Example. Flowchart Examples

- Accounts Department Activity Diagram
- Cross-Functional Flowchart (Swim Lanes) | Swim Lane Diagrams ...
- It Department Activity Diagrams
- Activity Diagram Purchasing Department
- Activity Diagram Tutorial For Financial And Accounting
- Accounting Activity Diagram
- Automated payroll management system UML activity diagram ...
- UML activity diagram (swimlanes) - Template | Cross-Functional ...
- UML Activity Diagram . Design Elements | C4ISR architecture ...
- Purchase order processing UML activity diagram | Purchasing ...
- UML activity diagram (swimlanes) - Template
- UML Activity Diagram | Diagramming Software for Design UML ...
- Process Flowchart | UML Activity Diagram . Design Elements | UML ...
- UML Activity Diagram | UML Diagram of Parking | Flow chart ...
- Swim Lanes In Activity Diagram
- UML activity diagram (swimlanes) - Template | Cross-Functional ...
- Finance Department Use Case Diagrams
- C4ISR architecture framework - IDEF0 activity diagram
- UML activity diagram - Cash withdrawal from ATM | UML Activity ...
- Activity Diagram Template