Flowchart Symbols Accounting. Activity-based costing (ABC) flowchart

Process Flowchart


"Project planning is part of project management, which relates to the use of schedules such as Gantt charts to plan and subsequently report progress within the project environment.
Initially, the project scope is defined and the appropriate methods for completing the project are determined. Following this step, the durations for the various tasks necessary to complete the work are listed and grouped into a work breakdown structure. Project planning is often used to organize different areas of a project, including project plans, work loads and the management of teams and individuals. The logical dependencies between tasks are defined using an activity network diagram that enables identification of the critical path. Float or slack time in the schedule can be calculated using project management software. Then the necessary resources can be estimated and costs for each activity can be allocated to each resource, giving the total project cost. At this stage, the project schedule may be optimized to achieve the appropriate balance between resource usage and project duration to comply with the project objectives. Once established and agreed, the project schedule becomes what is known as the baseline schedule. Progress will be measured against the baseline schedule throughout the life of the project. Analyzing progress compared to the baseline schedule is known as earned value management.
The inputs of the project planning phase include the project charter and the concept proposal. The outputs of the project planning phase include the project requirements, the project schedule, and the project management plan." [Project planning. Wikipedia]
The flow chart example "Project planning process" was created using the ConceptDraw PRO diagramming and vector drawing software extended with the Flowcharts solution from the area "What is a Diagram" of ConceptDraw Solution Park.
Flowchart - Project planning process

Process Flowchart Symbols

HelpDesk
How to Determine what Information to be Displayed in the Project Resource List


HelpDesk
What Information to be Displayed in the ConceptDraw PROJECT Gantt Chart View

HelpDesk
What Information can be Displayed in the Multiproject Dashboard View

HelpDesk
How to Plan and Allocate Resources in Your Project with ConceptDraw PROJECT for Windows

 Business Processes Area
Solutions of Business Processes area extend ConceptDraw PRO software with samples, templates and vector stencils libraries for drawing business process diagrams and flowcharts for business process management.
HelpDesk
How to Set a Project Baseline Using ConceptDraw PROJECT

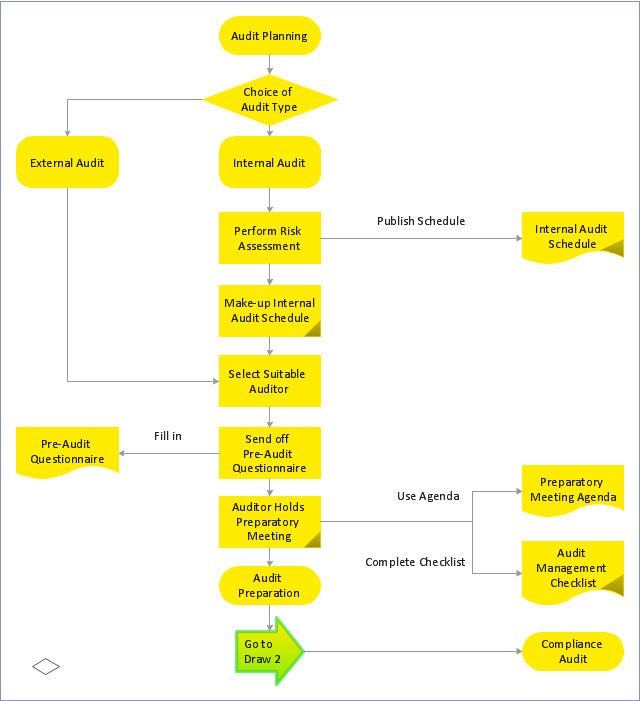
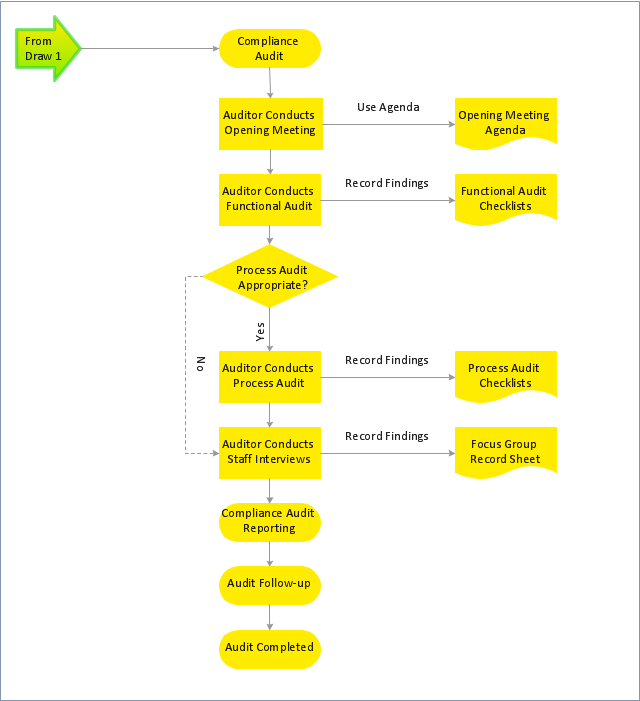
"Audit planning is a vital area of the audit primarily conducted at the beginning of audit process to ensure that appropriate attention is devoted to important areas, potential problems are promptly identified, work is completed expeditiously and work is properly coordinated. "Audit planning" means developing a general strategy and a detailed approach for the expected nature, timing and extent of the audit. The auditor plans to perform the audit in an efficient and timely manner. ...
An Audit plan is the specific guideline to be followed when conducting an audit. It helps the auditor obtain sufficient appropriate evidence for the circumstances, helps keep audit costs at a reasonable level, and helps avoid misunderstandings with the client.
It addresses the specifics of what, where, who, when and how:
What are the audit objectives?
Where will the audit be done? (i.e. scope)
When will the audit(s) occur? (how long?)
Who are the auditors?
How will the audit be done?" [Audit plan. Wikipedia]
The audit planning flowchart example was created using the ConceptDraw PRO diagramming and vector drawing software extended with the Audit Flowcharts solution from the Finance and Accounting area of ConceptDraw Solution Park.
www.conceptdraw.com/ solution-park/ finance-audit-flowcharts
Flowchart 1
Flowchart 2
HelpDesk
How to Track Your Project Plan vs. the Actual Project Condition

HelpDesk
How are Summary Values of Project Phases Calculated

BPM Software

- Flowchart Symbols Accounting. Activity-based costing (ABC ...
- Flowchart Symbols Accounting. Activity-based costing (ABC ...
- Flowchart Symbols Accounting. Activity-based costing (ABC ...
- Flowchart Symbols Accounting. Activity-based costing (ABC ...
- Process Flowchart | Flowchart Symbols Accounting. Activity-based ...
- Process Flowchart | Flowchart Symbols Accounting. Activity-based ...
- Basic Flowchart Symbols and Meaning | Flowchart Symbols ...
- Cost Management Process Flow Chart
- Flowchart Symbols Accounting. Activity-based costing (ABC ...
- Accounting Flowcharts | Accounting Flowcharts | Event-driven ...
- Flowchart Symbols Accounting. Activity-based costing (ABC ...
- Basic Flowchart Symbols and Meaning | Flowchart Symbols ...
- Basic Flowchart Symbols and Meaning | Flowchart design ...
- Process Flowchart | Flowchart Symbols Accounting. Activity-based ...
- Accounting Flowcharts | Flowchart Symbols Accounting. Activity ...
- Flowchart Symbols Accounting. Activity-based costing (ABC ...
- Flowchart Symbols Accounting. Activity-based costing (ABC ...
- Flowchart Symbols Accounting. Activity-based costing (ABC ...
- Flow chart Example. Warehouse Flowchart | Material Requisition ...
- Accounting Flowcharts | Flowchart Symbols Accounting. Activity ...