Structured Systems Analysis and Design Method (SSADM) with ConceptDraw DIAGRAM
Structured Systems Analysis and Design Method (abbr. SSADM) is a method developed in Great Britain and accepted in 1993 as a national standard for information systems development and analysis. SSADM is based on Data Flow Diagrams and is characterized with presence of clear sequence of steps at projecting, analysis, and documenting of information system. It involves 6 main stages: analysis of existing system or estimation of practicability, requirements definition, determination of technical requirements and equipment cost, development of logical data model, projecting of logical requirements and specification them, physical projecting. Each of them is also divided into several steps defining the tasks that should be fulfilled at a given stage. The most important SSADM elements are flows modeling with help of DFD, data logic modeling with help of LDS (Logical Data Structure) and description of entities behavior. Applying of SSADM is easy with ConceptDraw DIAGRAM diagramming and vector drawing software and Data Flow Diagram solution.SSADM Diagram
The vector stencils library SSADM from the solution Systems engineering contains specific symbols of SSADM diagrams for ConceptDraw DIAGRAM diagramming and vector drawing software. The Systems engineering solution is contained in Software Development area of ConceptDraw Solution Park. The example below illustrates the waterfall model used in SSADM. This model involves 5 stages of developing a product such as requirements specification and its' analysis, design, coding and testing.Data flow Model Diagram
This sample was created in ConceptDraw DIAGRAM diagramming and vector drawing software using the Data Flow Diagrams Solution from the Software Development area of ConceptDraw Solution Park. This sample shows the Data Flow Model Diagram that displays the Order system and the interactions between the Order system and Customers.How to Present a Social Media Response Plan DFD to Your Team
Interactive tool helps you find the appropriate response to social media mentions quickly. There are materials to help trainers and consultants develop a social media strategy and provide training for social media groups on how to effectively accomplish their daily work.
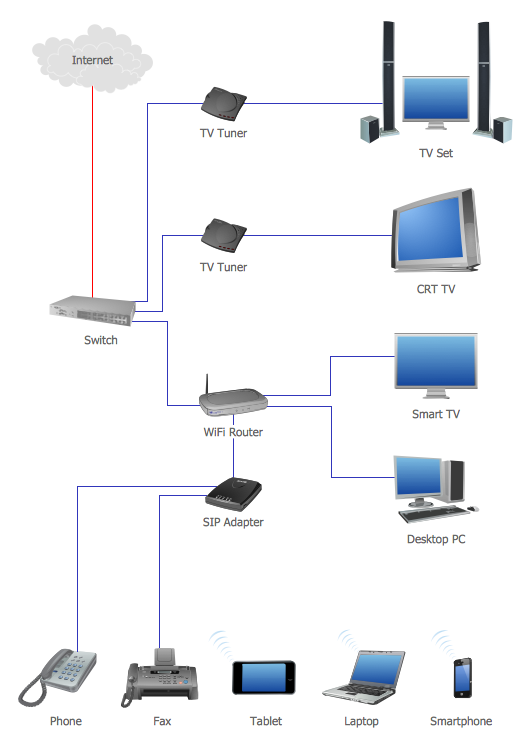
Network Topology Graphical Examples
Computer and Networks solution provides examples, templates and vector stencils library with symbols of local area network (LAN) and wireless LAN (WLAN) equipment. This example of computer network topology diagram shows home WLAN equipment and their connection to the Internet.Data Flow Diagram
Data Flow Diagram (DFD) is the part of the Structured Systems Analysis and Design Methodology (SSADM), which is intended for information systems projection and analysis. Data Flow Diagrams allow graphically represent the data flows in information system and analyze the data processing during the structural projection. This type of diagrams lets visually show a work of information system and results of this work, it is often used in connection with human processes and can be displayed as Workflow diagram. Data Flow Diagram visualizes processes and functions, external entities, data depositories, and data flows connecting these elements and indicating direction and data character. Each of these elements used for DFD has its own graphical notation. There are two notations to draw DFDs - Yourdon & Coad and Gane & Sarson. ConceptDraw DIAGRAM extended with Data Flow Diagrams (DFD) solution from Software Developmant area is ideal for designing professional looking DFDs, which can be then easily exported in various formats.Gane Sarson Diagram
The Gane-Sarson methodology uses the graphical techniques for building the logical models for the systems. It is helpful for analysts and designers to make common and clear picture of the system, to depict all its processes and how they transform the data. The Gane-Sarson methodology lets represent all this information in a way understandable for the users and other interested people, and gives the possibility to see instantly how the system's parts serve together to meet their needs. This methodology supposes the building of a system top-down. First you need create an overall system data flow, then determine the details of the data structures, the process logic and design the modular structures. ConceptDraw DIAGRAM diagramming and vector drawing software offers the Data Flow Diagrams solution with Gane-Sarson Notation library rich for the specific symbols of the Gane-Sarson notation. All they are vector and fully ready-to-use for drawing the Data Flow Diagrams, which will be then successfully used in presentations, websites, and various business documents.
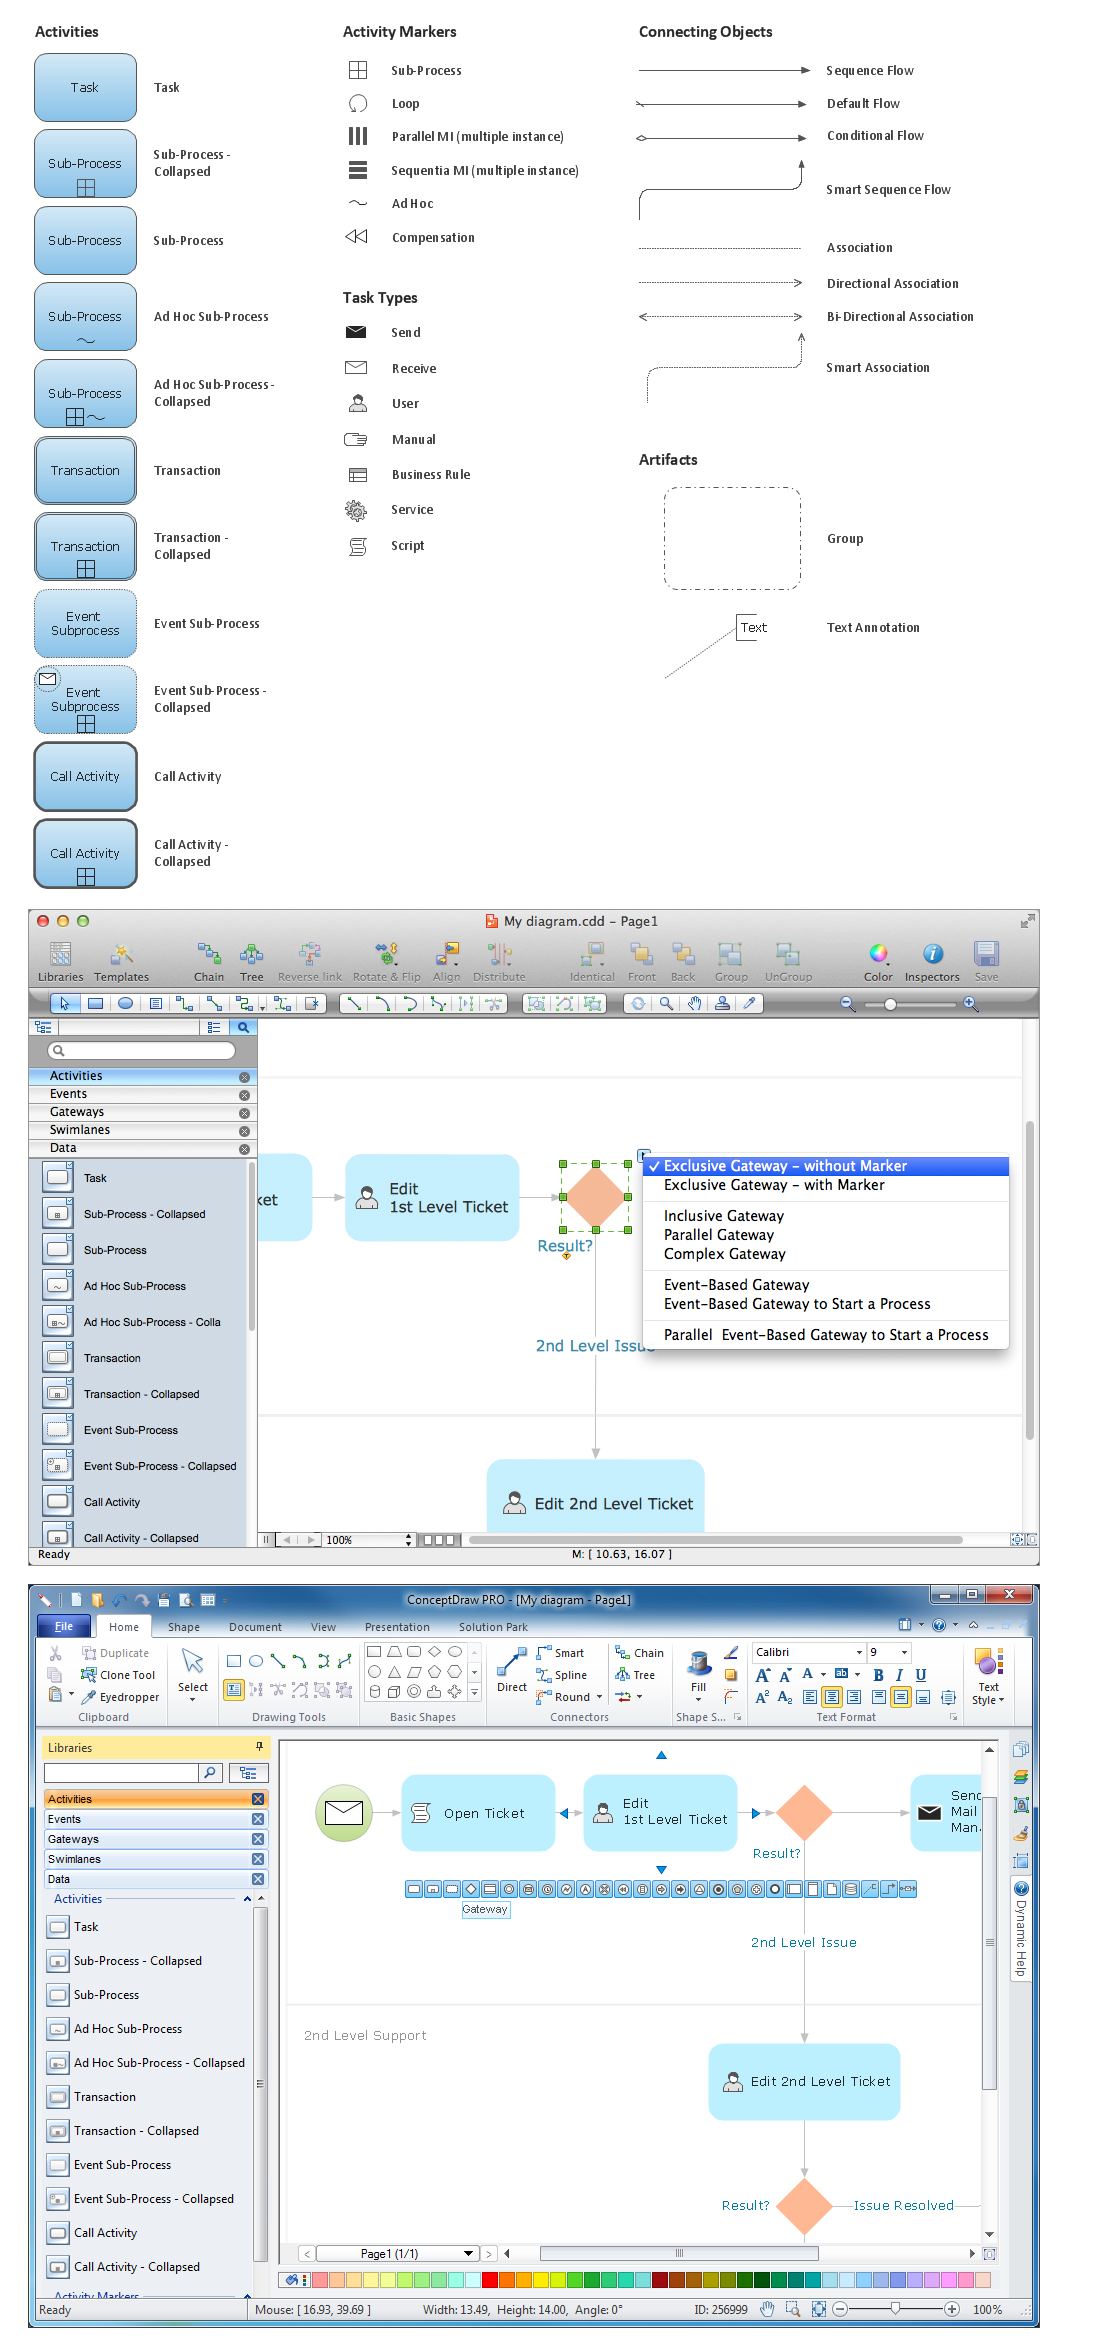
ConceptDraw DIAGRAM Compatibility with MS Visio
The powerful diagramming and business graphics tools are now not exception, but the norm for today’s business, which develop in incredibly quick temp. But with the abundance of powerful business diagramming applications it is important to provide their compatibility for effective exchange the information between the colleagues and other people who maybe use different software in their work. During many years Microsoft Visio™ was standard file format for the business and now many people need the visual communication software tools that can read the Visio format files and also export to Visio format. The powerful diagramming and vector drawing software ConceptDraw DIAGRAM is ideal from the point of view of compatibility with MS Visio. Any ConceptDraw DIAGRAM user who have the colleagues that use MS Visio or any who migrates from Visio to ConceptDraw DIAGRAM , will not have any problems. The VSDX (Visio′s open XML file format) and VDX formatted files can be easily imported and exported by ConceptDraw DIAGRAM , you can see video about this possibility.Diagramming Software for Business Process
Create professional business process diagram with ConceptDraw Activities library with 34 objects from BPMN.
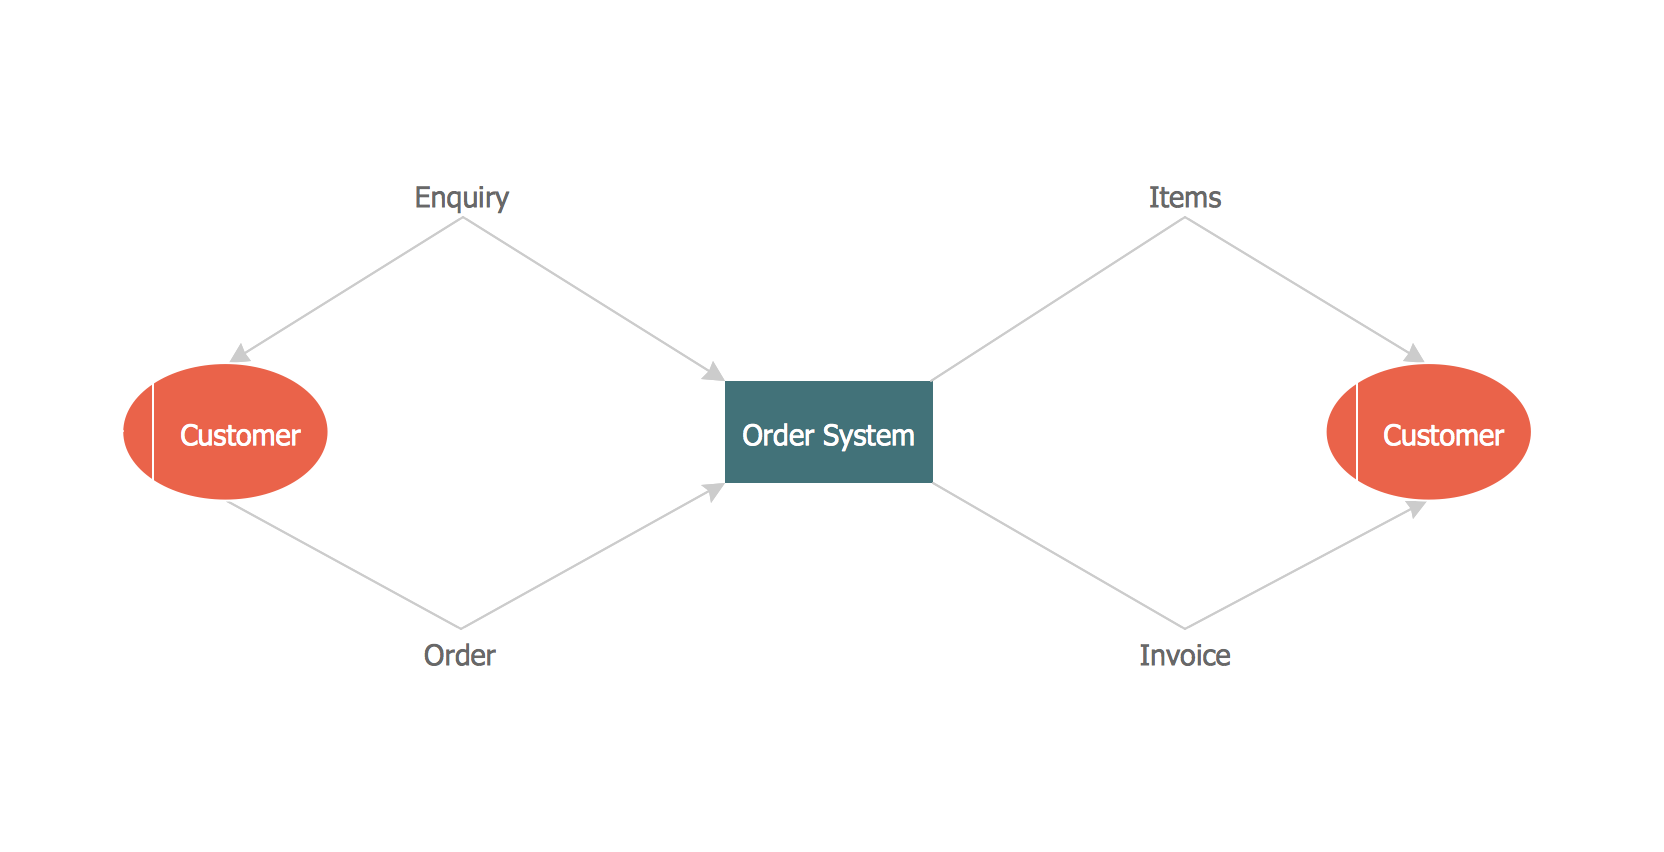
Context Diagram Template
This template shows the Context Diagram. It was created in ConceptDraw DIAGRAM diagramming and vector drawing software using the Block Diagrams Solution from the “Diagrams” area of ConceptDraw Solution Park. The context diagram graphically identifies the system. external factors, and relations between them. It’s a high level view of the system. The context diagrams are widely used in software engineering and systems engineering for designing the systems that process the information.
- Structured Systems Analysis and Design Method ( SSADM ) with ...
- SSADM Diagram | Structured Systems Analysis and Design Method ...
- Systems development life cycle | SSADM Diagram | Process ...
- SSADM Diagram | Agile Methodology | Agile Mind Maps: Exploring ...
- Data Modeling Notations Ssadm
- SSADM Diagram | Structured Systems Analysis and Design Method ...
- Systems development life cycle | SSADM Diagram | Circular Flow ...
- Waterfall Bar Chart | SSADM Diagram | Network Topology Graphical ...
- Agile Methodology | SSADM Diagram | Basic Flowchart Symbols ...
- Sales Process Flowchart. Flowchart Examples | Structured Systems ...