This site uses cookies. By continuing to browse the ConceptDraw site you are agreeing to our Use of Site Cookies.
HelpDesk

How to Draw a Pyramid Diagram

Pyramid diagram (triangle diagram) is used to represent data, which have hierarchy and basics. Due to the triangular form of a diagram, each pyramid section has a different width. The width of the segment shows the level of its hierarchy. Typically, the top of the pyramid is the data that are more important than the base data. A pyramid scheme can be used to show proportional and hierarchical relationships between some logically related items, such as departments within an organization, or successive elements of any process. This type of diagram is often used in marketing to display hierarchically related data, but it can be used in a variety of situations. ConceptDraw DIAGRAM allows you to make a pyramid diagram, quickly and easily using special libraries.
HelpDesk

How to Create a Bar Chart

Bar charts (bar graphs) are diagrams displaying data as horizontal or vertical bars of certain heights. Bar charts are widely used to show and compare the values of the same parameters for different data groups.
The bar graph can be vertical or horizontal. This depends on the number of categories. There are many methods in which bar graph can be built and this makes it a very often used chart type. Usually, a bar chart is created so that the bars are placed vertically. Such an arrangement means that the bar's height value is proportional to the category value. Nevertheless, a bar chart can be also drawn horizontally. This means that the longer the bar, the bigger the category. Thus, a bar chart is a good way to present the relative values of different measured items. The ConceptDraw Bar Graphs solution allows you to draw a bar chart quickly using a vector library, containing the set of various bar charts objects.

How to Create a Pyramid Diagram

ConceptDraw Pyramid Diagram software allows drawing column charts using predesigned objects or drawing tools. In ConceptDraw Pyramid Diagram software you can find a complete set of column chart tools and objects.

Draw flowcharts, block diagrams, histograms, pie charts, divided bar diagrams, line graphs, circular arrows diagrams, Venn diagrams, bubble diagrams, concept maps, business, draw, diagramming, solution park Basic Diagramming

Draw flowcharts, block diagrams, histograms, pie charts, divided bar diagrams, line graphs, circular arrows diagrams, Venn diagrams, bubble diagrams, concept maps, business, draw, diagramming, solution park
This solution extends ConceptDraw DIAGRAM software with the specific tools you need to easily draw flowcharts, block diagrams, histograms, pie charts, divided bar diagrams, line graphs, circular arrows diagrams, Venn diagrams, bubble diagrams and concept maps

How to Create a Column Chart

The question how to create a column chart have a simple answer. Use ConceptDraw tips to find out how to create a column chart depicts your data the best way.

How to Create a Bar Chart

The answer how to create a bar chart can be found in ConceptDraw software. The simple tips guide you through the software to quickly learn how to create a bar chart.

Cisco Routers. Cisco icons, shapes, stencils and symbols

Network infrastructure planning is a very important process in the network construction, and the share of time allocated to this within the scope of the entire project may reach 60-80%. A competent and thorough approach to planning contributes to the quick investment return, and also increases the reliability and flexibility of the final system, reducing the probability of additional costs related to the incorrect implementation.
Any planning begins with an analysis of the business requirements to the final system. Basic network parameters, which should be assessed are the scalability, accessibility, cost, speed and safety.
Speed and cost are often mistaken for the most important parameters, and the rest of the parameters aren't even remembered. This is not entirely correct. Initially, it is necessary to assess the business plans for the future, because sometimes it is more profitable to invest more money in the beginning. If the business is to develop, then, consequently, demands on

Cisco Security. Cisco icons, shapes, stencils and symbols

The ConceptDraw vector stencils library "Cisco Security" contains 16 symbols of security devices and equipment for drawing the computer network diagrams using the ConceptDraw DIAGRAM diagramming and vector drawing software.

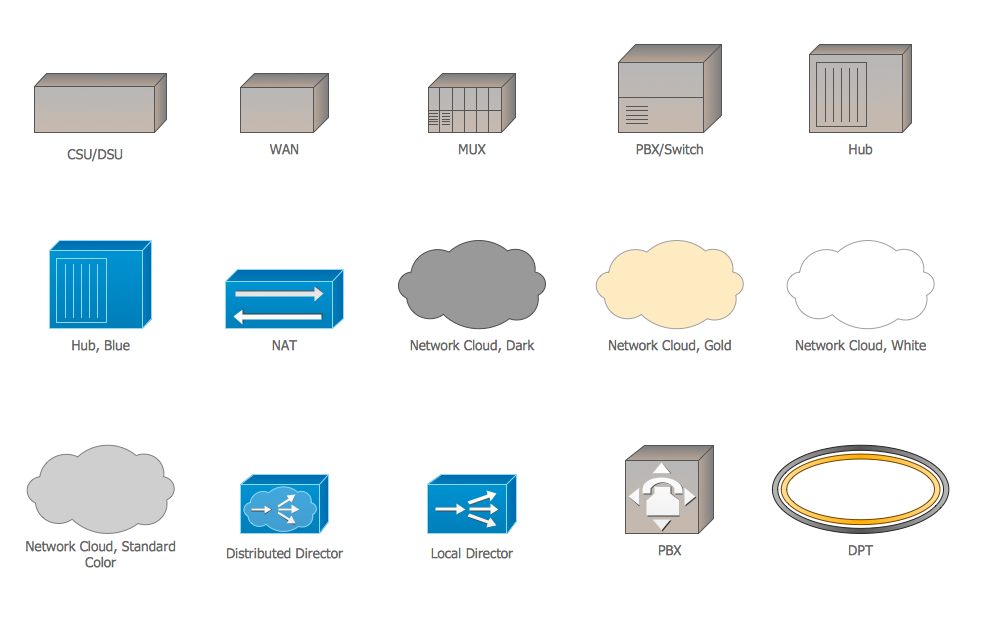
Cisco WAN. Cisco icons, shapes, stencils and symbols

The ConceptDraw vector stencils library Cisco WAN contains equipment symbols for drawing the computer wide area network diagrams.
HelpDesk

How to Draw a Histogram

Histogram is a diagram used to visualize data through bars of variable heights. Making histogram can be helpful if you need to show data covering various periods (hours, days, weeks, etc). When the vertical column of the histogram refer to frequency it shows how many times any event happens. It is a Frequency histogram. A bar chart diagram is similar to a histogram, but in contrast to a bar chart a histogram represents the number how many times there have been certain data values. You can use a histogram to depict continual data flow such as temperature, time, etc. You can effortlessly draw histograms using the Histograms solution for CnceptDraw DIAGRAM. Making a histogram can by very useful to represent various statistical data.

Cisco Switches and Hubs. Cisco icons, shapes, stencils and symbols

Cisco switches and hubs deliver the best performance, and often used as network solutions for small businesses, enterprises, data centers. Cisco switches are the core interconnect devices of each computer network. The numerous Cisco switches specifically designed for various applications. Network switches are separated for two types: fixed configuration and modular switches. The fixed configuration switches deprecate swapping or adding another module, and vice versa for modular switch.

Local area network (LAN). Computer and Network Examples

A local area network (LAN) is a devices network that connect with each other in the scope of a home, school, laboratory, or office. Usually, a LAN comprise computers and peripheral devices linked to a local domain server. All network appliances can use a shared printers or disk storage. A local area network serve for many hundreds of users. Typically, LAN includes many wires and cables that demand a previously designed network diagram. They are used by IT professionals to visually document the LANs physical structure and arrangement.
ConceptDraw - Perfect Network Diagramming Software with examples of LAN Diagrams. ConceptDraw Network Diagram is ideal for network engineers and network designers who need to draw Local Area Network diagrams.
How to Draw a Computer Network

Pyramid Diagram

Pyramid diagrams help you visualize information as a triangle divided into horizontal slices. Labelled slices represent a hierarchy. Pyramids are used in marketing presentations to show and analyze hierarchy levels.
3D triangular diagram of DIKW pyramid has 6 levels: measurement, facts, data, information, knowledge, wisdom.
The data component include different scattered signs or symbols which are merely useless until these random objective facts are somehow processed. Data is a resource which has to be manipulated or rearranged to get useful. Information can be extracted from a pile of data, it also can be mined from different data storages.

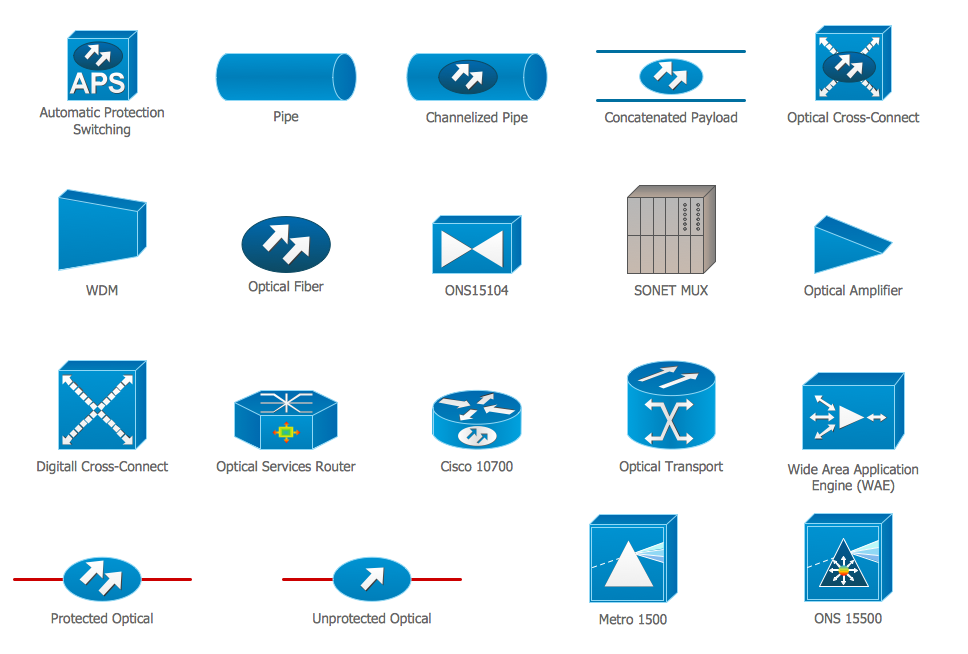
Cisco Optical. Cisco icons, shapes, stencils and symbols

The ConceptDraw vector stencils library Cisco Optical contains symbols for drawing the computer network diagrams.

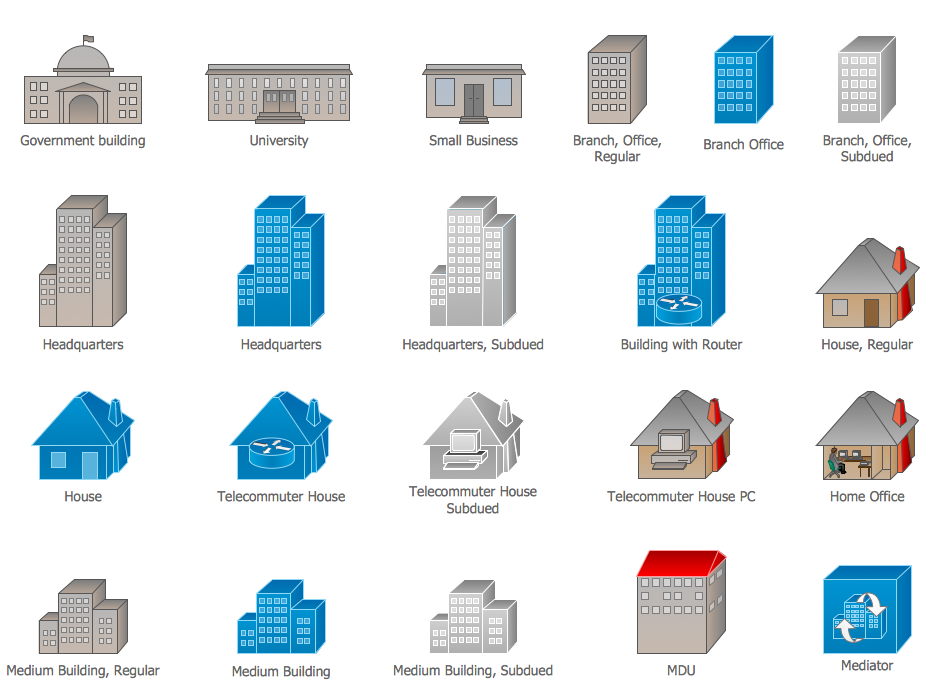
Cisco Buildings. Cisco icons, shapes, stencils and symbols

Cisco icons are globally recognized and generally accepted as standard for network icon topologies. The ConceptDraw vector stencils library "Cisco buildings" contains 21 symbols for drawing the computer network diagrams using the ConceptDraw DIAGRAM diagramming and vector drawing software.