 Bar Graphs
The Bar Graphs solution enhances ConceptDraw DIAGRAM functionality with templates, numerous professional-looking samples, and a library of vector stencils for drawing different types of Bar Graphs, such as Simple Bar Graph, Double Bar Graph, Divided Bar Graph, Horizontal Bar Graph, Vertical Bar Graph, and Column Bar Chart.
HelpDesk
How to Create a Bar Chart

Chart Examples

Chart Templates

 Directional Maps
Directional Maps solution extends ConceptDraw DIAGRAM software with templates, samples and libraries of vector stencils for drawing the directional, location, site, transit, road and route maps, plans and schemes.
 Pyramid Diagrams
Pyramid Diagrams solution extends ConceptDraw DIAGRAM software with templates, samples and library of vector stencils for drawing the marketing pyramid diagrams.
Pyramid Diagram and Pyramid Chart

HelpDesk
How to Draw a Histogram

Tools to Create Your Own Infographics

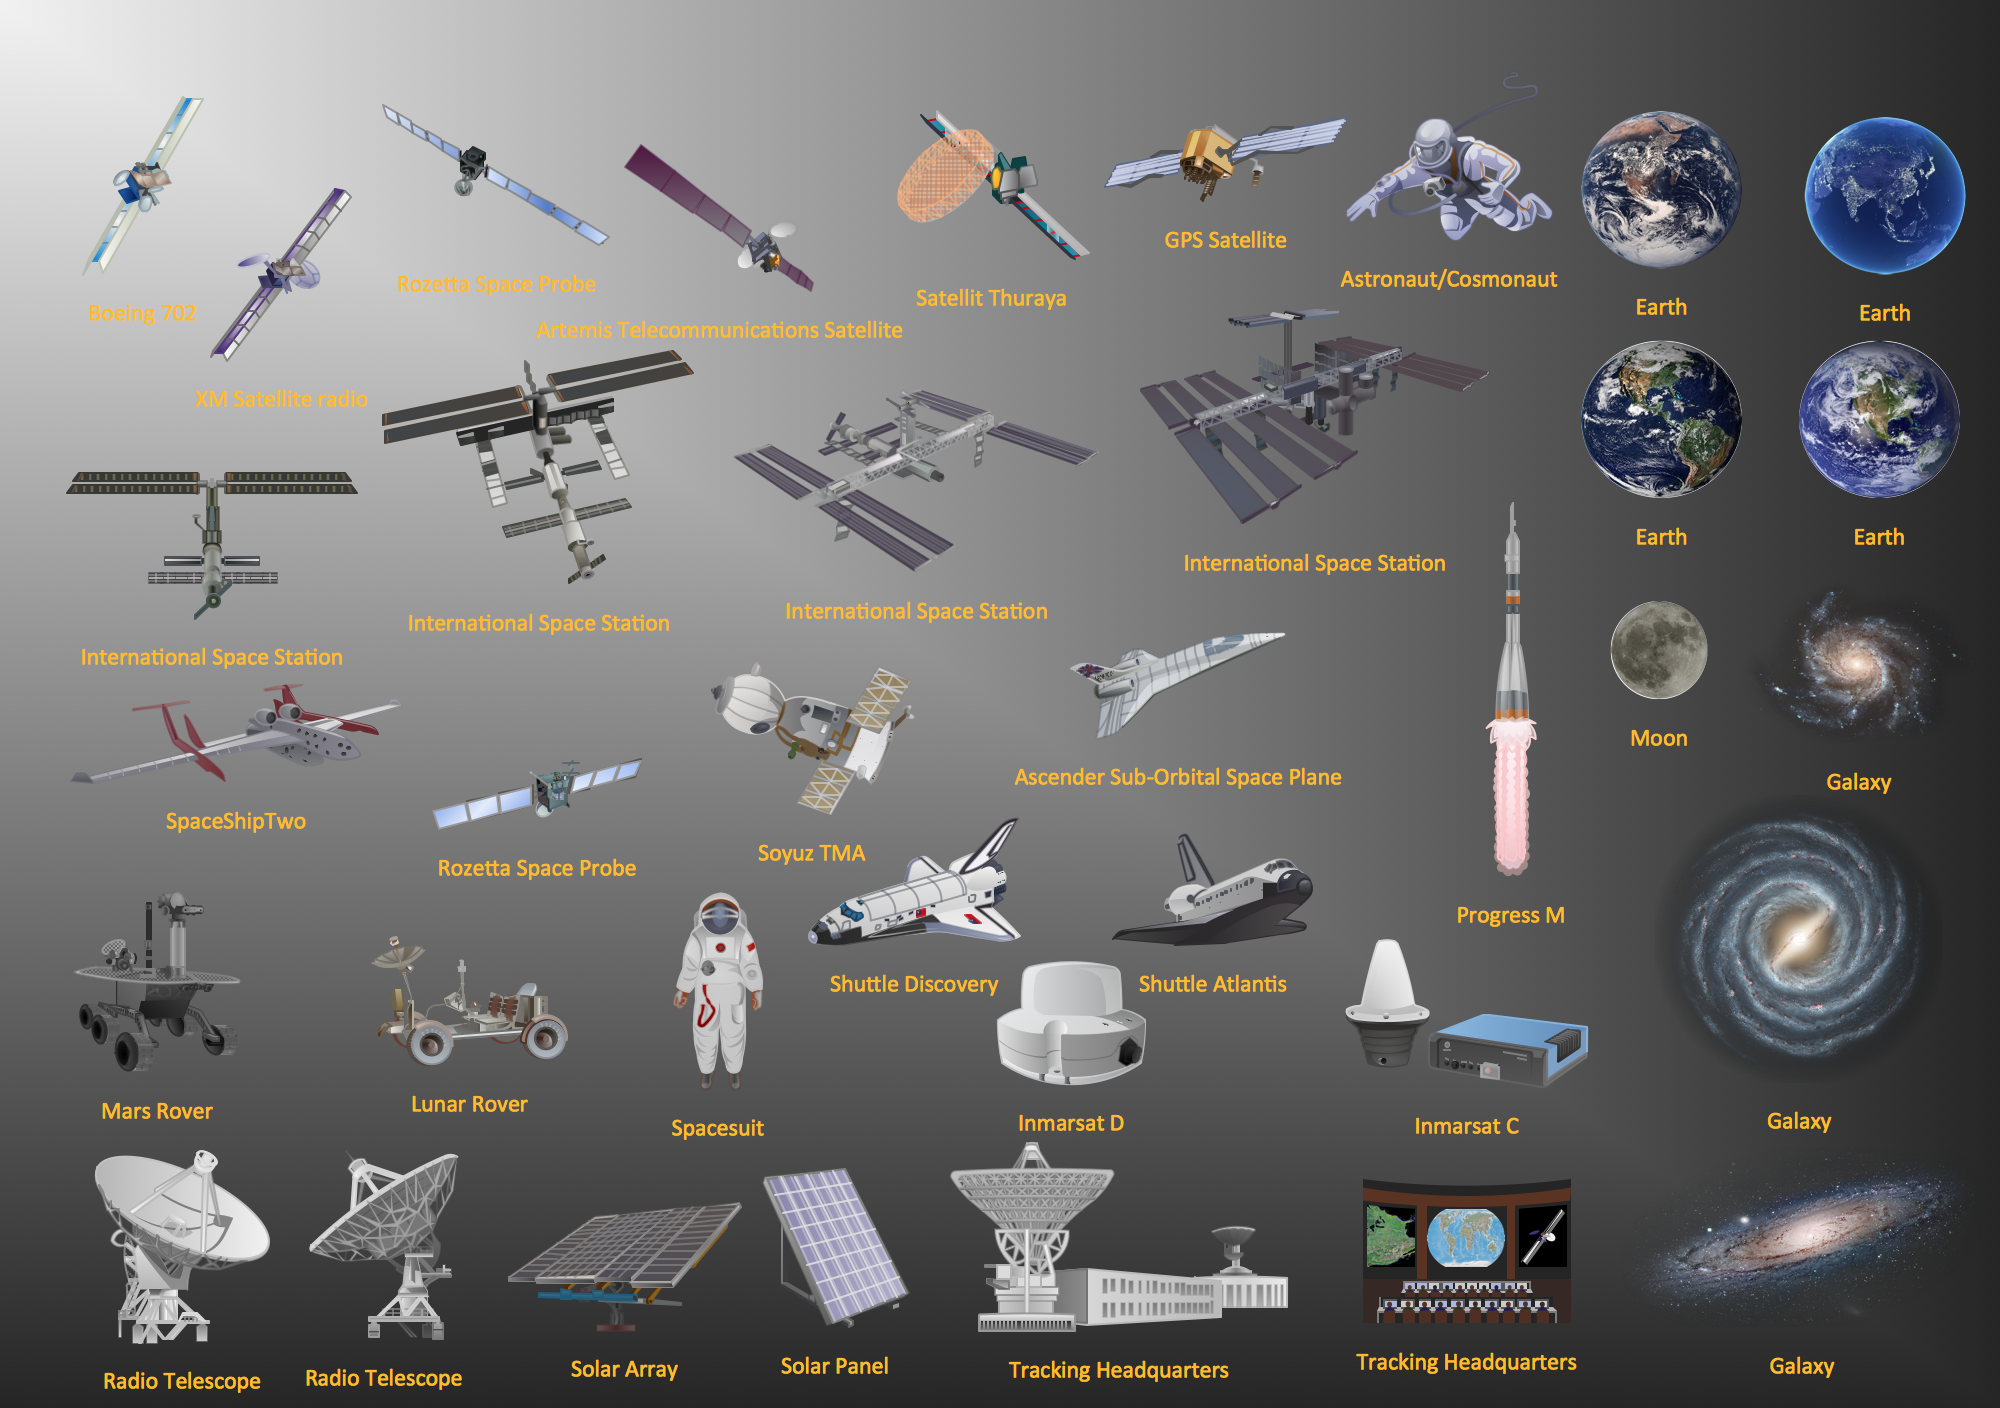
Aerospace - Design Elements
 Block Diagrams
Block diagrams solution extends ConceptDraw DIAGRAM software with templates, samples and libraries of vector stencils for drawing the block diagrams.
 Histograms
How to make a Histogram? Making a Histogram is an incredibly easy process when it is done with ConceptDraw DIAGRAM. The Histograms Solution enhances ConceptDraw DIAGRAM functionality with extensive drawing tools, numerous samples, and examples; also a quick-start template and library of ready vector stencils for visualization the data and professional drawing Histograms.
Pyramid Diagram

Pyramid Charts

 Audio, Video, Media
Use it to make professional-looking documents, impressive presentations, and efficient websites with colorful and vivid illustrations and schematics of digital audio, video and photo gadgets and devices, audio video connections and configurations, S Video connection, HD and 3D television systems, home entertainment systems, Closed-circuit television (CCTV) surveillance systems. All audio video schematics, drawings and illustrations designed in ConceptDraw DIAGRAM are professional looking, clear and understandable for all thanks to applying the most commonly used standards of designations, and are effective for demonstrating in front of a small audience and on the big screens.
- 3D Column chart - Iran internet users per 100 person | Column Chart ...
- 3D Column chart - Iran internet users per 100 person | 3D Bar graph ...
- 3D Column chart - Iran internet users per 100 person | SWOT Matrix ...
- Bar Chart Software
- Internet Connectivity. Computer and Network Examples | Internet ...
- 3D Column chart - Iran internet users per 100 person | Person ...
- Graphs Png
- 3d Circle Png
- Bar Graphs Png
- Bar Chart Software | Column Chart Software | Chart Maker for ...
- Bar Graphs | Sales Growth. Bar Graphs Example | Bar Chart ...
- Person Vector Png
- Column Chart Software | Vessels - Vector stencils library ...
- Column Chart Examples | Column Chart Template | Column Chart ...
- Bar Graphs | 3D Column chart - Iran internet users per 100 person ...
- Providing telecom services - Cross-functional flowchart | 3D Column ...
- Metropolitan area networks (MAN). Computer and Network ...
- Bar Chart Icon Png
- How to Create a Bar Chart in ConceptDraw PRO | 3D Column chart ...
- Column Chart Examples | Column Chart Software | Chart Maker for ...