The vector stencils library "Education indicators" contains 12 graphic indicators.
Use these visual indicators to design your educational infogram.
The vector stencils library "Education indicators" is included in the Education Infographics solution from the Business Infographics area of ConceptDraw Solution Park.
Use these visual indicators to design your educational infogram.
The vector stencils library "Education indicators" is included in the Education Infographics solution from the Business Infographics area of ConceptDraw Solution Park.
1-Sector donut chart

2-Sectors donut chart

1-Sector pie chart

2-Sectors pie chart

2-Bars horizontal bar chart

2-Columns arrow chart
Bullet indicator

Progress bar

Radial gauge

Semi-radial gauge

Square chart 10x10 - filling from above

Stickman row pictograph

Chart Maker for Presentations

The vector stencils library "Management indicators" contains 14 visual indicators.
Use it to create your management infogram in the ConceptDraw PRO diagramming and vector drawing software.
The example "Management indicators - Vector stencils library" is included in the solution "Marketing infographics" from the "Business infographics" area of ConceptDraw Solution Park.
Use it to create your management infogram in the ConceptDraw PRO diagramming and vector drawing software.
The example "Management indicators - Vector stencils library" is included in the solution "Marketing infographics" from the "Business infographics" area of ConceptDraw Solution Park.
1-Sector donut chart

1-Sector pie chart

2-Bars horizontal bar chart

2-Columns arrow chart
2-Columns arrow chart 2
2-Sectors donut chart

2-Sectors pie chart

Bullet indicator

Progress bar

Radial gauge

Semi-radial gauge

Square chart 10x10 - filling from above

Square chart 10x10 - filling from below

Stickman row pictograph

The vector stencils library "Management indicators" contains 14 visual indicators.
Use it to create your management infogram in the ConceptDraw PRO diagramming and vector drawing software.
The example "Management indicators - Vector stencils library" is included in the solution "Marketing infographics" from the "Business infographics" area of ConceptDraw Solution Park.
Use it to create your management infogram in the ConceptDraw PRO diagramming and vector drawing software.
The example "Management indicators - Vector stencils library" is included in the solution "Marketing infographics" from the "Business infographics" area of ConceptDraw Solution Park.
1-Sector donut chart
1-Sector pie chart
2-Bars horizontal bar chart
2-Columns arrow chart
2-Columns arrow chart 2
2-Sectors donut chart
2-Sectors pie chart
Bullet indicator
Progress bar
Radial gauge
Semi-radial gauge
Square chart 10x10 - filling from above
Square chart 10x10 - filling from below
Stickman row pictograph
The vector stencils library "Education indicators" contains 12 graphic indicators.
Use these visual indicators to design your educational infogram.
The vector stencils library "Education indicators" is included in the Education Infographics solution from the Business Infographics area of ConceptDraw Solution Park.
Use these visual indicators to design your educational infogram.
The vector stencils library "Education indicators" is included in the Education Infographics solution from the Business Infographics area of ConceptDraw Solution Park.
1-Sector donut chart
2-Sectors donut chart
1-Sector pie chart
2-Sectors pie chart
2-Bars horizontal bar chart
2-Columns arrow chart
Bullet indicator
Progress bar
Radial gauge
Semi-radial gauge
Square chart 10x10 - filling from above
Stickman row pictograph
The vector stencils library "Sales dashboard" contains 27 charts and graphic indicators.
Use it for drawing sales dashboards in the ConceptDraw PRO diagramming and vector drawing software extended with the Sales Dashboard solution from the Marketing area of ConceptDraw Solution Park.
Use it for drawing sales dashboards in the ConceptDraw PRO diagramming and vector drawing software extended with the Sales Dashboard solution from the Marketing area of ConceptDraw Solution Park.
Column Chart

Bar Chart

Line Chart

Divided Bar

Pie Chart

Two Bubbles Indicator

Speedometer Gauge 1

Speedometer Gauge 2

Speedometer Gauge 3

Speedometer Gauge 4

Slider Horizontal 1

Slider Horizontal 2

Slider Horizontal 3

Slider Horizontal 4

Slider Horizontal 5

Slider Horizontal 6

Slider Horizontal 7

Slider Vertical 1

Slider Vertical 2

Slider Vertical 3

Bullet 1

Bullet 2

Bullet 3

Bullet 4

Backgroung 1

Backgroung 2

Backgroung 3

The vector stencils library "Composition indicators" contains 6 dashboard graphic indicators: 2 horizontal divided bars, 2 vertical divided bars, and 2 mini pie charts.
Composition Indicators are Live Objects which show the percentage of two parts of one total.
Composition Indicators useful for:
• comparison of one part with the total
• comparison of two parts of one total.
Use this library for drawing visual dashboards in the ConceptDraw PRO diagramming and vector drawing software extended with the Composition Dashboard solution from the area "What is a Dashboard" of ConceptDraw Solution Park.
www.conceptdraw.com/ solution-park/ composition-dashboard
Horizontal Divided Bar Indicator 1

Mini Pie Chart Indicator 1

Vertical Divided Bar Indicator 1

Horizontal Divided Bar Indicator 2

Vertical Divided Bar Indicator 2

Mini Pie Chart Indicator 2

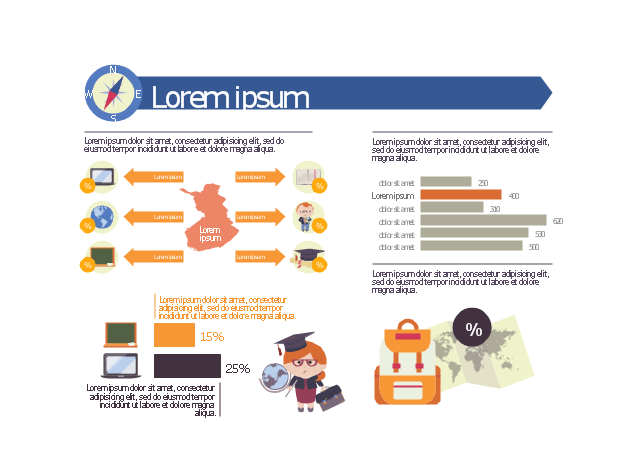
This education infographic template consists of design elements: callouts, world map contour, horizontal bar chart indicator, horizontal bar graph, pictograms.
Simply add text and data to design your educational infogram.
The template "Education infogram 2" for the ConceptDraw PRO diagramming and vector drawing software is included in the Education Infographics solition from the area "Business Infographics" in ConceptDraw Solution Park.
Simply add text and data to design your educational infogram.
The template "Education infogram 2" for the ConceptDraw PRO diagramming and vector drawing software is included in the Education Infographics solition from the area "Business Infographics" in ConceptDraw Solution Park.
Educational infogram template
Bar Chart

How to Create a Bar Chart

Chart Software for Better Presentations

Bar Chart Examples

Bar Graph

How to Create a Column Chart

Bar Chart Software

- 2 -Bars horizontal bar chart
- Population Horizontal Bar Chart
- Infographic Horizontal Bar
- Education Bar Chart
- 2 -Bars horizontal bar chart
- Education charts - Vector stencils library | How to Draw the Different ...
- How to Draw a Divided Bar Chart in ConceptDraw PRO | Divided ...
- Horizontal Pie Charts
- Horizontal Bar Chart Percentage
- Arrows Bar Chart
- Design elements - Comparison charts and indicators
- Gauge Chart
- Comparison indicators - Vector stencils library | Design elements ...
- Chart Examples | Education indicators - Vector stencils library ...
- Bar Chart Template for Word | Column Chart Template | Chart Maker ...
- Gauges Chart Howto
- Bar Graphs
- Management indicators - Vector stencils library | Management ...
- Dashboard Divided Bar Horizontal
- Bar charts - Vector stencils library | Rainfall Bar Chart | Bar Chart ...