System Block Diagram Software
Block Diagram provides a functional view of a hardware or software system and processes within it, the interconnections between its components. A better understanding of system functions is given in this way. Block Diagrams are successfully used in most industries to illustrate functional processes. They find a wide application in areas like software design, electrical engineering, process control, and many others. In the software development area, the blocks and system building blocks describe a system as a collection of parts, depict data elements, operators, and control flow elements.
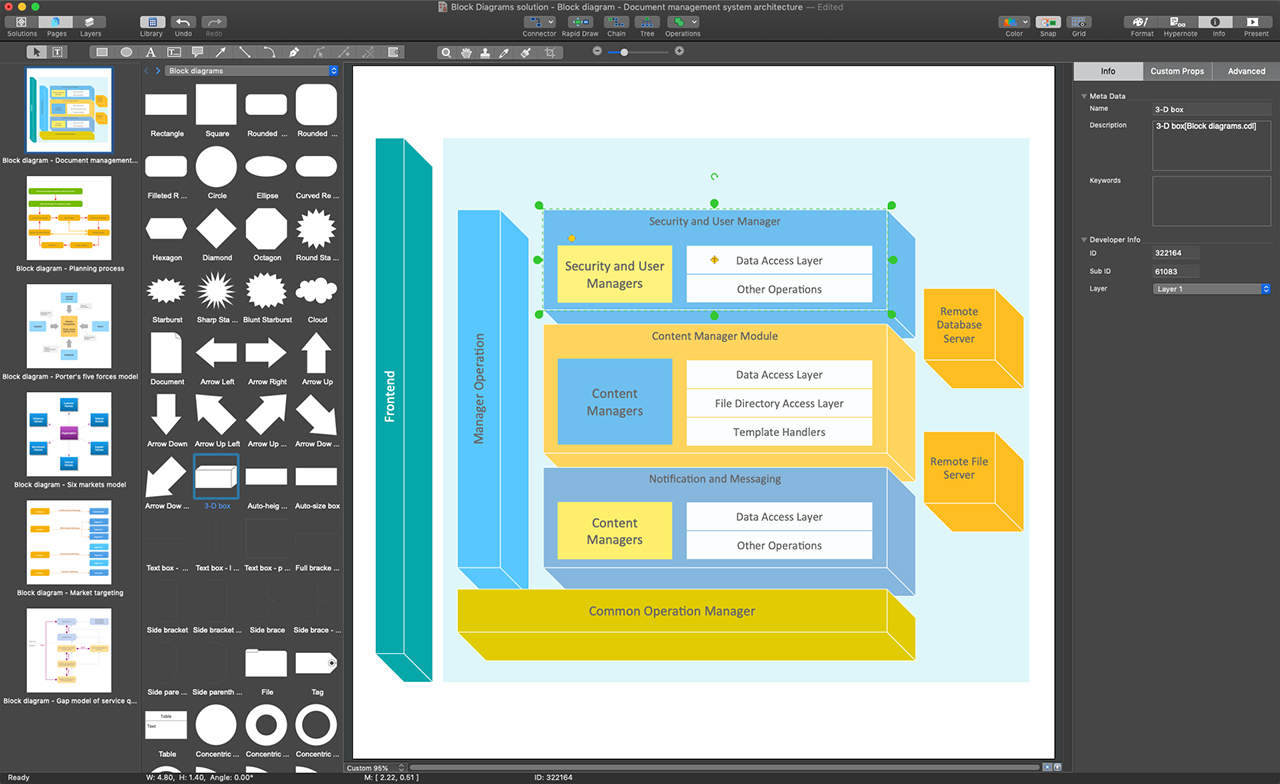
System Block Diagram is mostly a hardware-oriented type of Block Diagram. It is successfully used to separate an overall system into sub-systems or encapsulated functional modules. These large interacting components are visually shown in a diagram and give an instant understanding of how these parts are gathered into a whole system. The role and responsibilities of each module are obligatorily indicated in a diagram. The description of each module gives a better understanding of a system as a whole. This view on a system provides its flexibility and allows simple extending and developing a system, adding new components. Each of these components suits for further independent and parallel development.
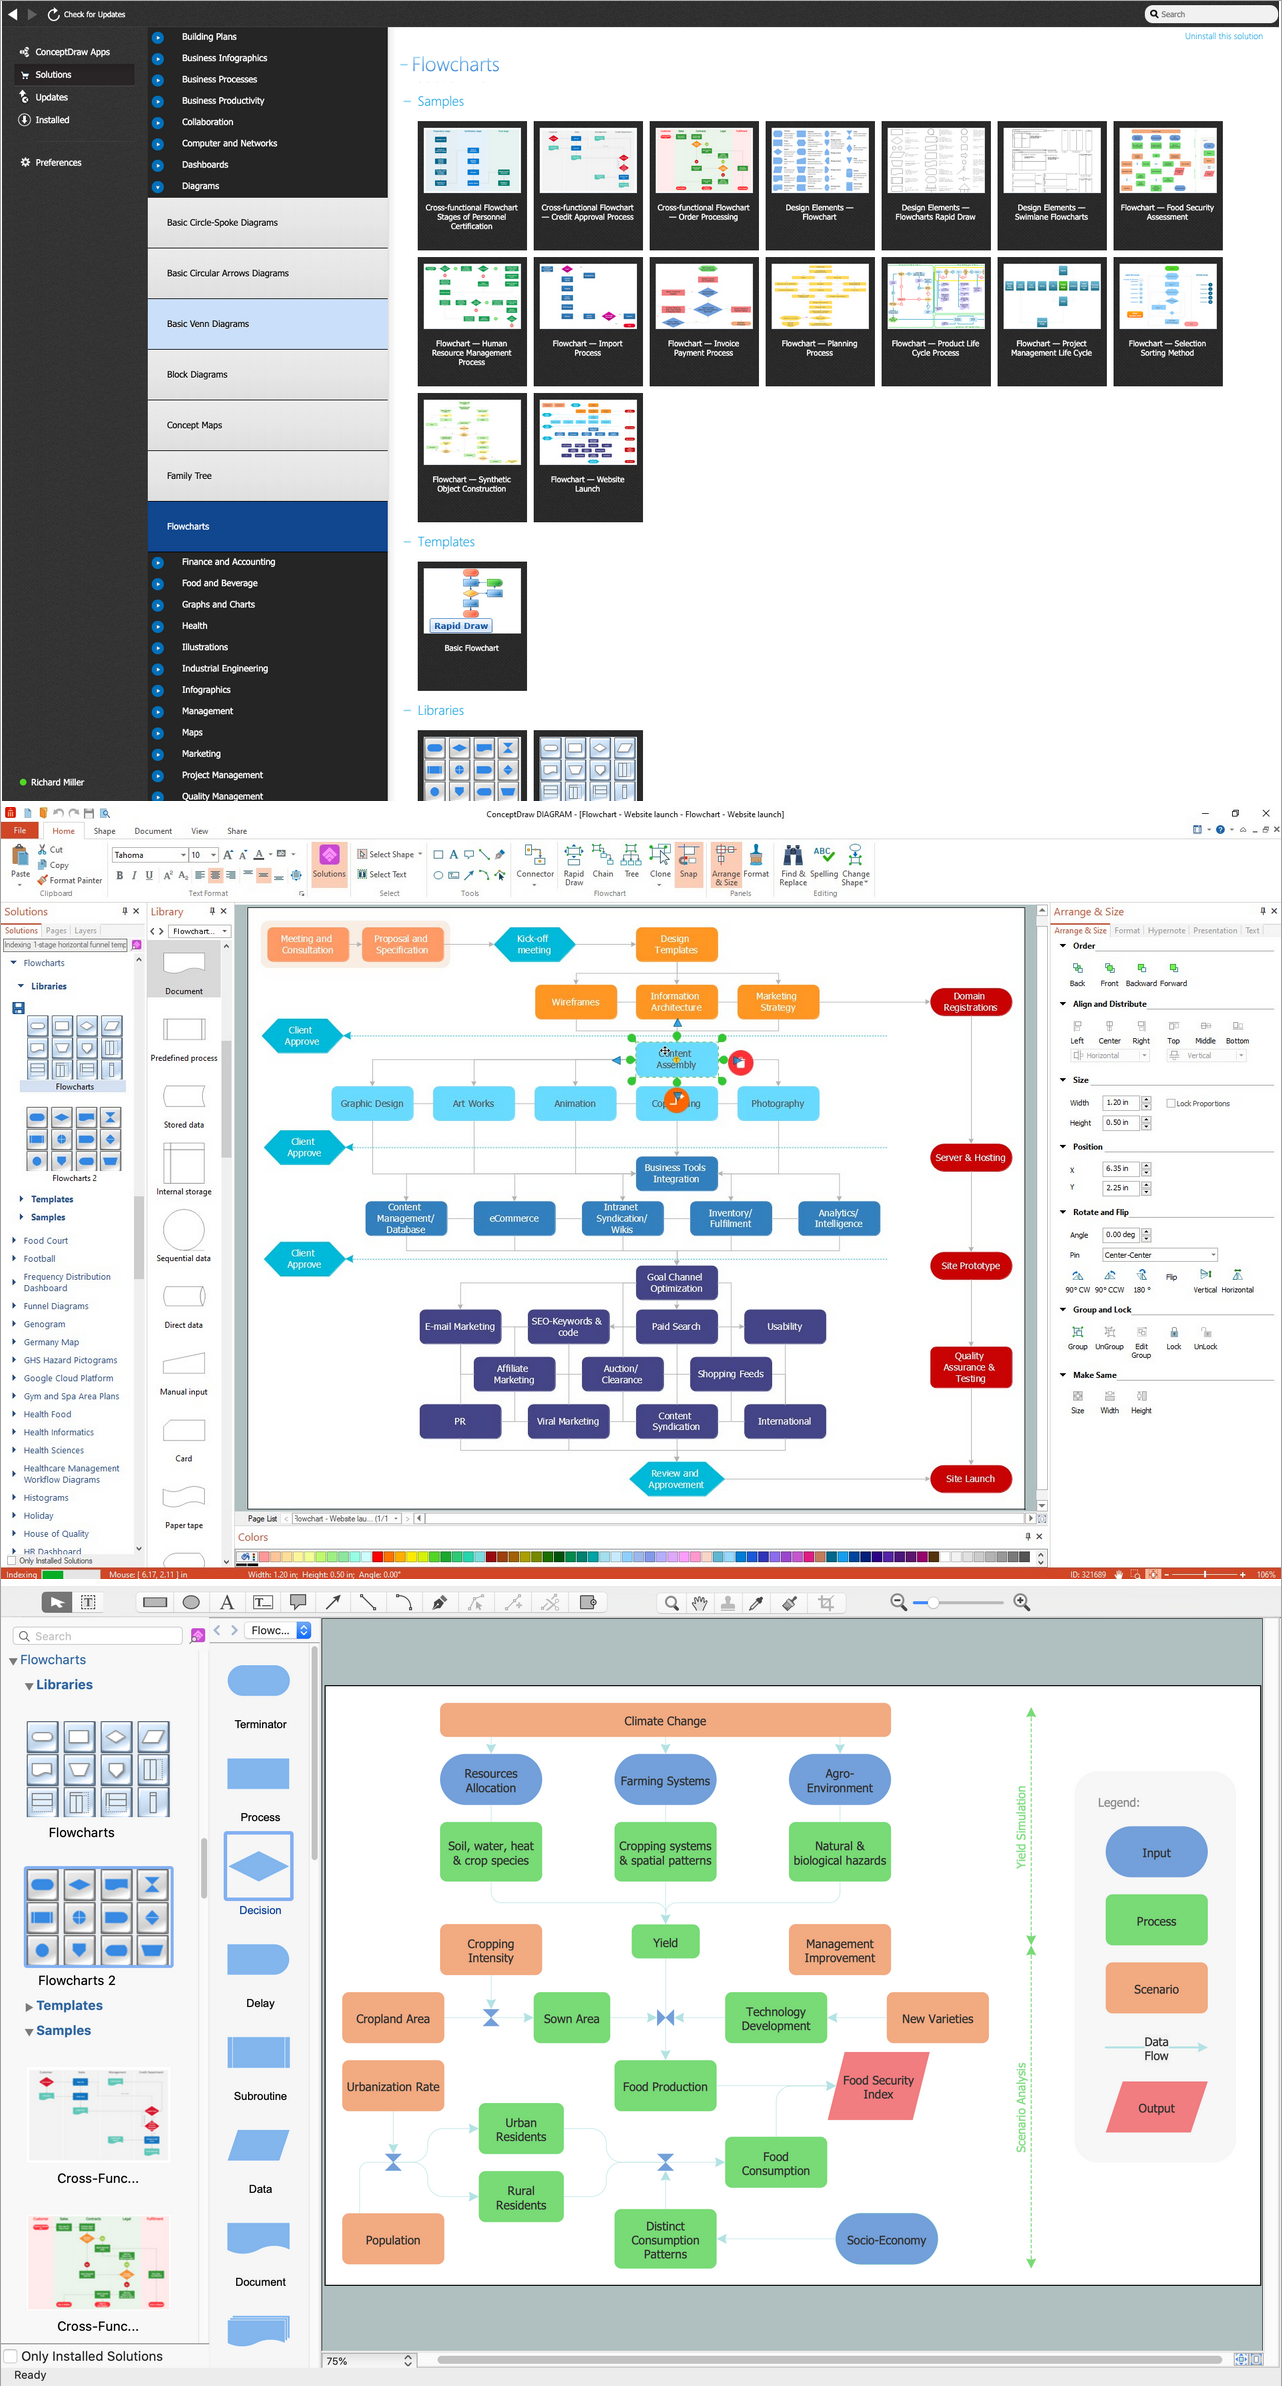
Block Diagrams solution makes ConceptDraw DIAGRAM a powerful system Block Diagram software. It enables you to work with all variety of tools you love in this software. It includes an enormous quantity of predesigned objects and connectors needed to design your Block Diagrams in minutes. The included templates and samples are useful for a quick start. Use these tools to design extremely fast and simply Block Diagrams looking like those created by experts, even if you are a beginner.
Example 1. ConceptDraw DIAGRAM - System Block Diagram Software
Make your Block Diagrams effortlessly with built-in vector objects offered in 5 libraries of Block Diagrams solution if you prefer to start from scratch. Otherwise, use one of three quick-start templates also included in this solution and available from the ConceptDraw STORE. The use of a template is the quickest way of drawing. Once your System Block Diagram is built, use the formatting features to make it corresponding to your company's style.

Example 2. Blocks 2D Template
The following features make ConceptDraw DIAGRAM the best system Block Diagram software:
- You don't need to be an artist to draw professional-looking diagrams in a few minutes.
- Large quantity of ready-to-use vector objects makes your drawing diagrams quick and simple.
- Great number of predesigned templates and samples give you a good start for your own diagrams.
- ConceptDraw DIAGRAM provides you the possibility to use the grid, rules, and guides. You can easily rotate, group, align, arrange the objects, use different fonts and colors to make your diagram exceptionally looking.
- All ConceptDraw DIAGRAM documents are vector graphic files and are available for reviewing, modifying, and converting to a variety of formats: image, HTML, PDF file, MS PowerPoint Presentation, Adobe Flash, MS Visio.
- Using ConceptDraw STORE you can navigate through ConceptDraw Solution Park, managing downloads and updates. You can access libraries, templates, and samples directly from the ConceptDraw STORE.
- If you have any questions, our free of charge support is always ready to come to your aid.