Public Utility Icons
Public utility services are facilities provided by the government to satisfy the needs and wants of citizens. These services include water, electricity, and gas supply, sewer, garbage disposal and recycling, public transport (air, road, water, railway), banking system, postal system, insurance, and many more. These services are essential for people and play a vital role in economic and social development. The government is responsible for extending access to public utility services. It ensures reliable universal access to public utilities for all communities, keeps them running smoothly, and strives to improve the efficiency of delivery.
Water, electricity, and gas are the primary utilities for the population. Water utility companies treat, deliver, and distribute clean drinking water to homes and enterprises, also manage wastewater treatment and stormwater systems to protect waterways from pollution and prevent flooding. They are responsible for the protection of the environment and public health. Electric utilities companies are occupied by electricity generation from coal, natural gas, nuclear energy, or renewable resources, and its transmission and distribution to both residential and commercial consumers. Their operation is strictly controlled and managed by the government regarding environmental standards, cost of services, and customer service standards. Gas utilities companies are responsible for maintaining the manufacturing and distribution of natural gas safely and efficiently.
Qualitative utilities increase the comfort, quality of the population's life, and help to eradicate poverty. They provide the appropriate functioning of the buildings and enterprises. Therefore, the control and development of new strategies to improve public utility services is really important. Such telecommunications services as phone, internet, cable TV, radio, and other communication services also belong to public utility services. However, they are not essential services and you can choose provider and service level on your own according to your requirements. Home security is a less common utility, but also one of the important additional services, which provides safety.
Example 1. Public Utility Icons in Infographics Design
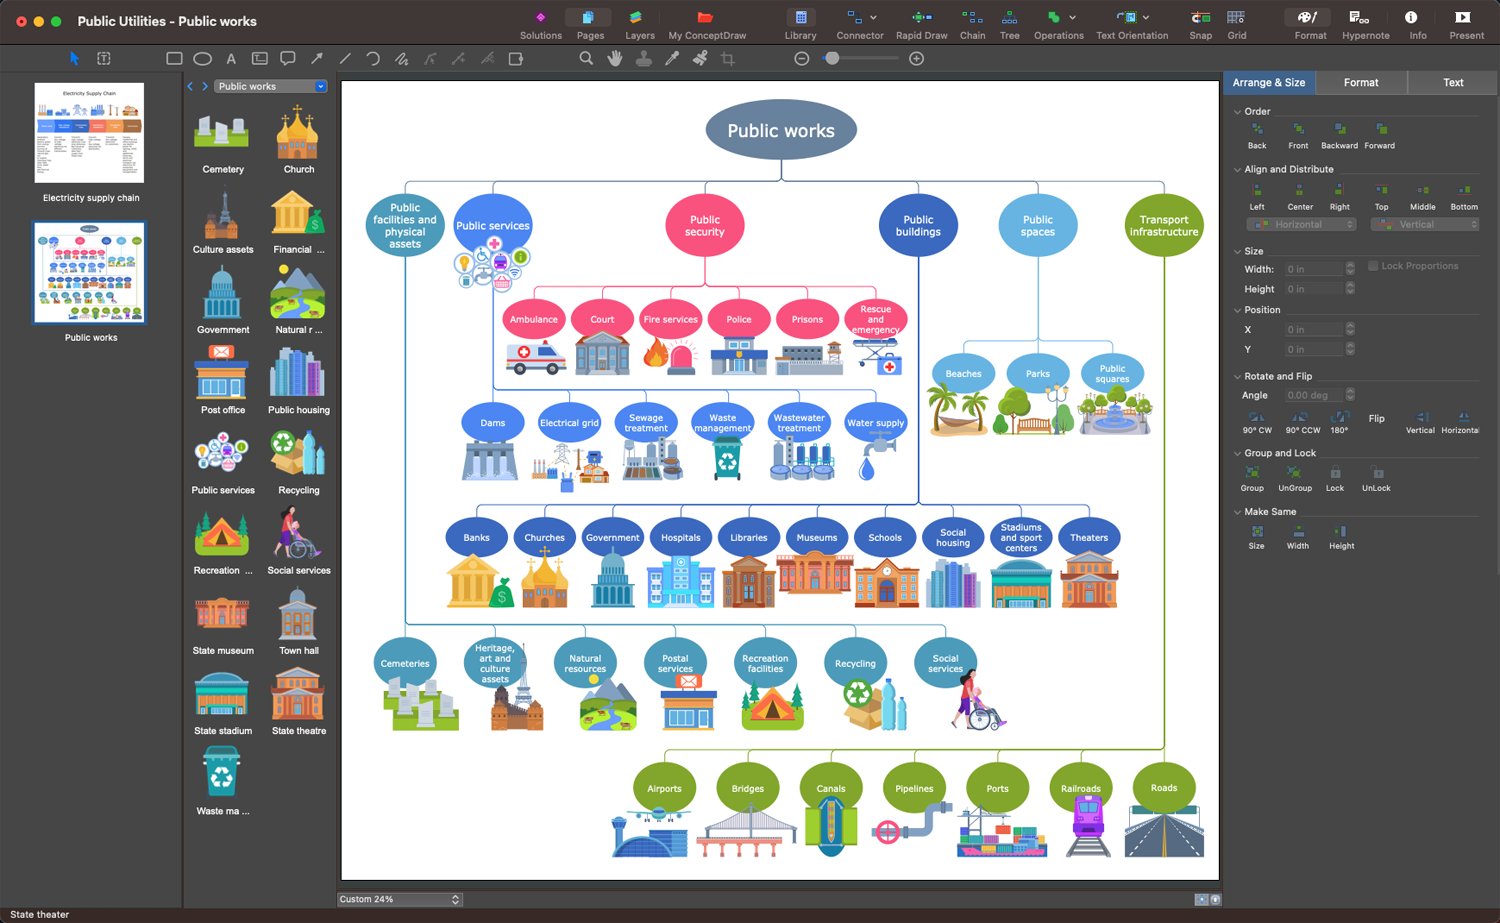
The public utility icons are essential elements to design drawing materials that display public utilities, their importance and features, and narrate about the newest technologies in this area. Public Utilities solution for ConceptDraw DIAGRAM vector drawing software provides a set of libraries with multifarious public utility icons. Use them to design your professional-looking infographics, diagrams, and illustrations related to public utilities in minutes.

Example 2. Public Utilities Solution Libraries Design Elements
12 libraries of the Public Utilities solution include a large collection of vector design icons and clipart:
- Central Heating
- Electricity Supply
- Gas Service
- Public Education
- Public Healthcare
- Public Security
- Public Spaces
- Public Transit
- Public Works
- Traffic Management
- Transport Asset Management
- Water and Sewage

Example 3. Public Healthcare Initiatives
The Public Utilities Infographics samples you see on this page were created in ConceptDraw DIAGRAM software using the drawing tools of the Public Utilities Solution. These examples successfully demonstrate solution's capabilities and the professional results you can achieve using it. An experienced user spent 10-15 minutes creating each of these samples.
Use the powerful tools of the Public Utilities solution to design your own Public Utilities Infographics quick, easy, and effective.
All source documents are vector graphic documents. They are available for reviewing, modifying, or converting to a variety of formats (PDF file, MS PowerPoint, MS Visio, and many other graphic formats) from the ConceptDraw STORE. The Public Utilities Solution is available for ConceptDraw DIAGRAM users.
TEN RELATED HOW TO's:
Do you like the professional schemes that you can find on the Internet? Take into account that the most part of them is made using the Best Flowchart Software and Flowchart Symbols. Try you own powers in creating such diagrams!
Flowcharts are the most business diagramming tool. If you are a business manager, you can use flow chart to depict work flow in your organization, develop the effective organizational structure and present the information to investors or other stakeholders. Combining the smart management solutions with ConceptDraw DIAGRAM diagramming engine delivers the set of comprehensive flowchart tools necessary to support professionals in their creativeness and business activity.
Picture: Best Flowchart Software and Flowchart Symbols
Related Solution:
Database structures are usually described by ER-diagrams which represents entities as boxes with lines-connections between them. You can create any entity-relationship diagram (ERD) by means of ConceptDraw DIAGRAM using ready-to-use templates and special libraries containing all the needed symbols and shapes. Creating a model for your database from now on can take just a few minutes.
ERD (entity relationship diagram) designed to show the logical structure of databases. It intended to depict the relationships between data components (entities). ERDs are a popular tool for software engineers and architects. Using ERD they can manage the every aspect of database design. Also ERD can be used as guidelines for testing and communications before software release. This diagram represents the file reference system of the WordPress web platform. Because entity relationship diagrams have such a broad application area through the prevalence of database technology, it can be applied for a wide range of users.
Picture: Entity-Relationship Diagram (ERD) with ConceptDraw DIAGRAM
Related Solution:
UML Collaboration Diagram Example Illustration. This sample was created in ConceptDraw DIAGRAM diagramming and vector drawing software using the UML Collaboration Diagram library of the Rapid UML Solution from the Software Development area of ConceptDraw Solution Park.
This sample shows the creation process of the contact list and can be used at the staff training and staff working, at the attraction process the new clients.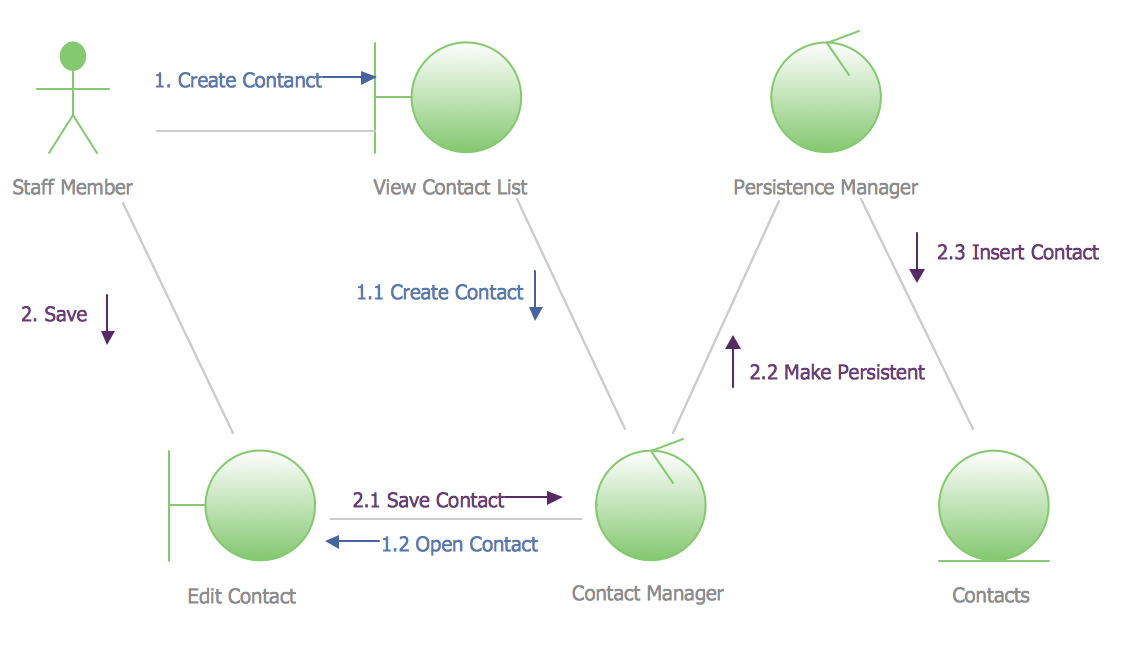
Picture: UML Collaboration Diagram Example Illustration
Related Solution:
ConceptDraw DIAGRAM diagramming and vector drawing application is a powerful IDEF0 software thanks to the IDEF0 Diagrams solution from the Software Development area of ConceptDraw Solution Park.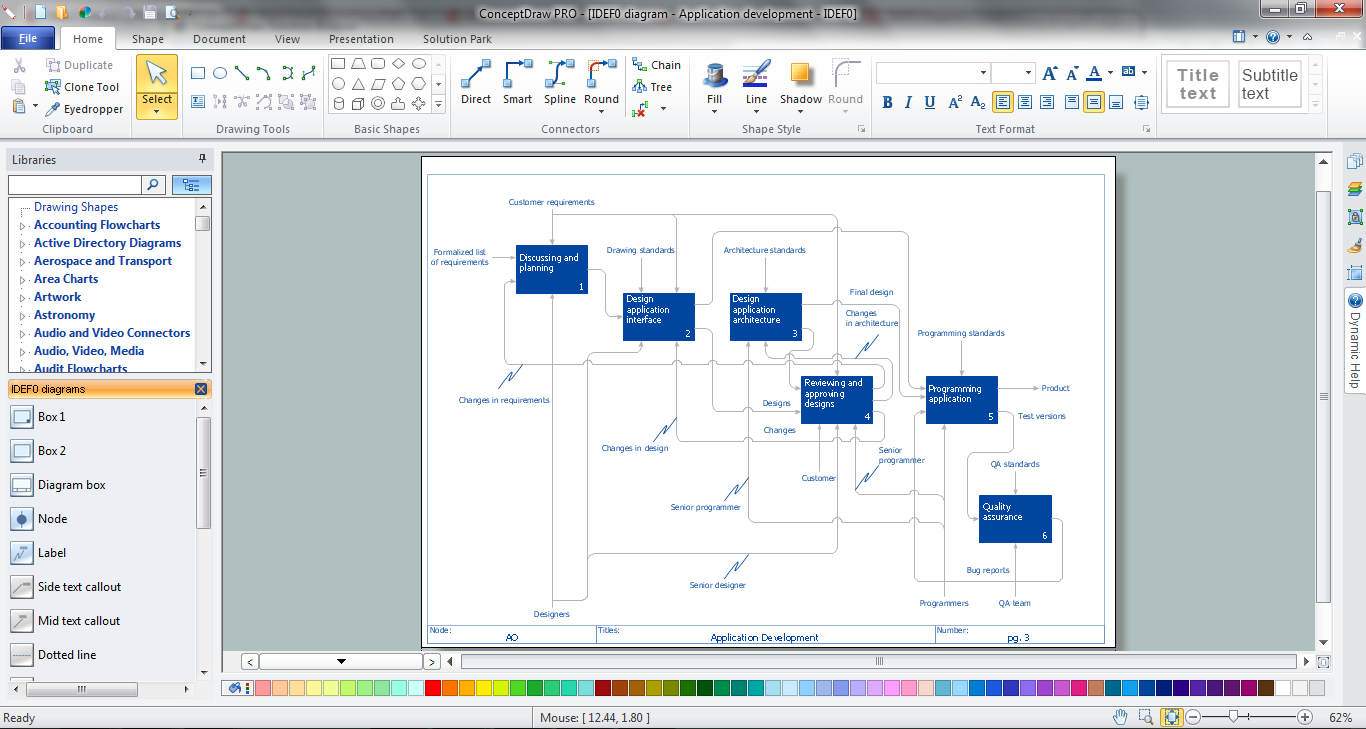
Picture: IDEF0 Software
Related Solution:
If you ever wanted to try any diagramming tools except of Visio, but were afraid to lose existing documents, there’s good news for you. One of the most striking features of ConceptDraw DIAGRAM is it’s perfect compatibility with MS Visio, which guarantees that you won’t depend on operating system anymore, because another ConceptDraw DIAGRAM feature is that it’s cross-platform tool. Don’t waste your time looking for other options, you’ve found the solution already!
Business professionals often utilize the MS Visio as a common tool for making various issues on business visualization. MS Visio is a strong software with good capacity to maintain complex business solutions. But there is no MS Visio for Apple OS X. This is a large invocation, and one would be pleased to recognize that ConceptDraw DIAGRAM is the ideal alternative to MS Visio. Primarily, because this software works natively on both Windows and Apple OS X platforms. if you have migrated from Windows to Mac, or need to communicate in a cross-platform conditions, you’ll search for MS Visio replacer. ConceptDraw DIAGRAM is the exclusive professional business diagramming application that runs on both Windows and Apple OS X. The opportunity exchange files between PC and Mac, as well as between ConceptDraw DIAGRAM and Visio is the significant advantage that permits you to display and to collaborate business information in effortless and cost-effective way.
Picture: ConceptDraw DIAGRAM Compatibility with MS Visio
Acquaintance with flowcharting starts from getting into basic terms. First of all, flowchart definition is quite clear – a flowchart is a graphical representation of a process or an algorithm made of special symbols. Secondly, flowcharting is an irreplaceable tool for IT specialists, project managers, and anyone who wants a clear understanding of any imaginable process.
Picture: Flowchart Definition: A Complete Guide
Related Solution:
ConceptDraw DIAGRAM extended with IDEF0 Diagrams solution from the Software Development area of ConceptDraw Solution Park is a powerful diagramming and vector drawing IDEF0 software. All IDEF0 diagrams created in ConceptDraw DIAGRAM are vector graphic documents and can be reviewed, modified and converted to MS Visio XML format. To obtain the IDEF0 Visio documents from ConceptDraw DIAGRAM documents use the wide export possibilities of ConceptDraw DIAGRAM.
Picture: IDEF0 Visio
Related Solution:
Also included are standardized hr flowchart symbols, meaning your diagrams will be relevant and understood by all business associates.
Picture: HR Flowchart Symbols
Related Solution:
Sales process management is a business discipline which focuses on the development and practical application of various sales techniques, and on the management of sales operations of the company.
It is effective to use professional software for the sales process management. ConceptDraw DIAGRAM diagramming and vector drawing software extended with Sales Flowcharts solution from the Marketing area of ConceptDraw Solution Park is the best choice.

Picture: Sales Process Management
Related Solution:
ConceptDraw DIAGRAM is a flowchart design software. There are large collections of professional flowchart symbols for process flow diagrams, standard flowchart symbols and colored basic flowchart symbols. Built-in examples and video lessons allow users to get started immediately and do drawing of virtually any type of flowchart or process flow diagrams
Picture: Flow Chart Creator
Related Solution: