Example 1. Classroom Seating Charts
School and Training Plans Solution includes the School Layout Library with 19 predesigned vector objects of chairs, desks, chalkboards, and other furniture for the classroom design. Use them actively drawing your own classroom seating charts and save your time!

Example 2. School Layout Library Design Elements
Simply drag the desired vector shapes from the School Layout library, and from the other libraries from Building Plans Area solutions if needed, arrange them, make some style changes, and your professional looking classroom chart will be ready.

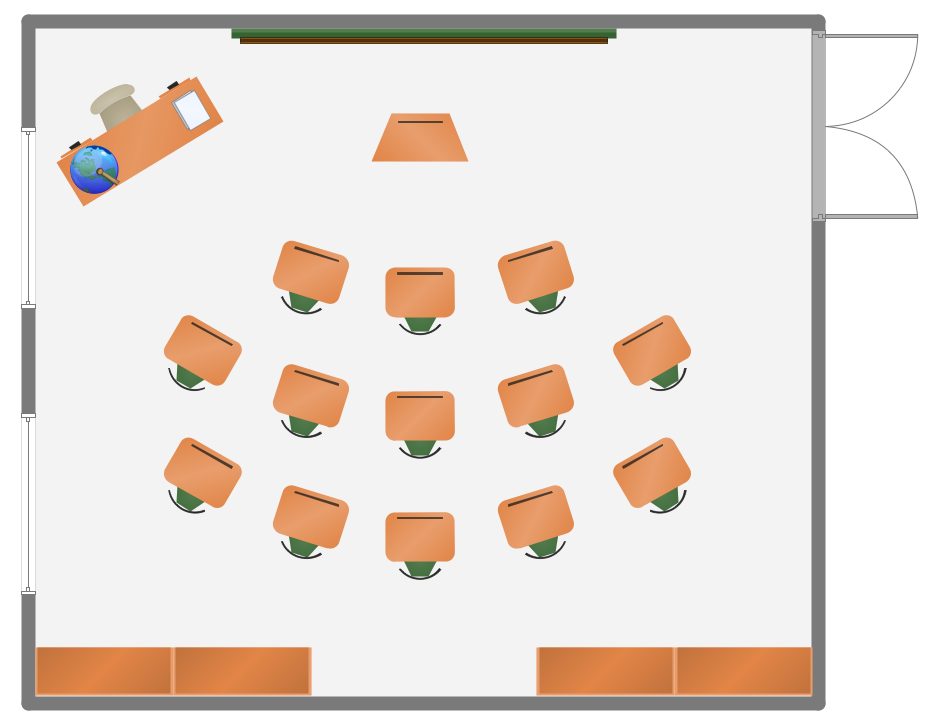
Example 3. Classroom Seating Charts - Creative Classroom
This sample was created in ConceptDraw DIAGRAM using the tools of School and Training Plans Solution. It shows the detailed plan for the furniture and seating places arrangement at the creative classroom. An experienced user spent 15 minutes creating this sample.
The Classroom Seating Charts designed with ConceptDraw DIAGRAM are vector graphic documents and are available for reviewing, modifying, converting to a variety of formats (image, HTML, PDF file, MS PowerPoint Presentation, Adobe Flash or MS Visio), printing and send via e-mail in one moment.
TEN RELATED HOW TO's:
Electrical plan is a document that is developed during the first stage of the building design. This scheme is composed of conventional images or symbols of components that operate by means of electric energy. To simplify the creation of these schemes you can use house electrical plan software, which will not require a long additional training to understand how to use it. You only need to install the necessary software ant it’s libraries and you’ll have one less problem during the building projection.
Any building contains a number of electrical systems, including switches, fixtures, outlets and other lightening equipment. All these should be depicted in a building electrical plans and included to general building documentation. This home electrical plan displays electrical and telecommunication devices placed to a home floor plan. On the plan, each electrical device is referenced with the proper symbol. Electrical symbols are used for universal recognition of the building plan by different persons who will be working on the construction. Not all possible electric symbols used on a certain plan, so the symbols used in the current home plan are included to a legend. The electrical home plan may be added as a separate document to a complete set of building plans.
Picture: How To use House Electrical Plan Software
Related Solution:
Any classroom is unique for the room layout, for the location of windows and lighting, the purposes of the classes are also different, so the arrangement of chalkboard and seating places will be different and must consider all these points. ConceptDraw DIAGRAM software extended with School and Training Plans Solution from the Building Plans Area of ConceptDraw Solution Park offers you the possibility to design the Classroom Seating Charts of any complexity.Picture: Classroom Seating Charts
Related Solution:
The Building Plans area of ConceptDraw Solution Park includes a set of solutions of Interior Design. The Interior Design solutions for ConceptDraw DIAGRAM allow you simply and quickly create the professional looking Building Plans that will help you to design, redesign your room, flat, home, office, cafe or any other building. Having the ready plan of the rooms you can easy rearrange the furniture, interior objects on the plan and see the future result at once.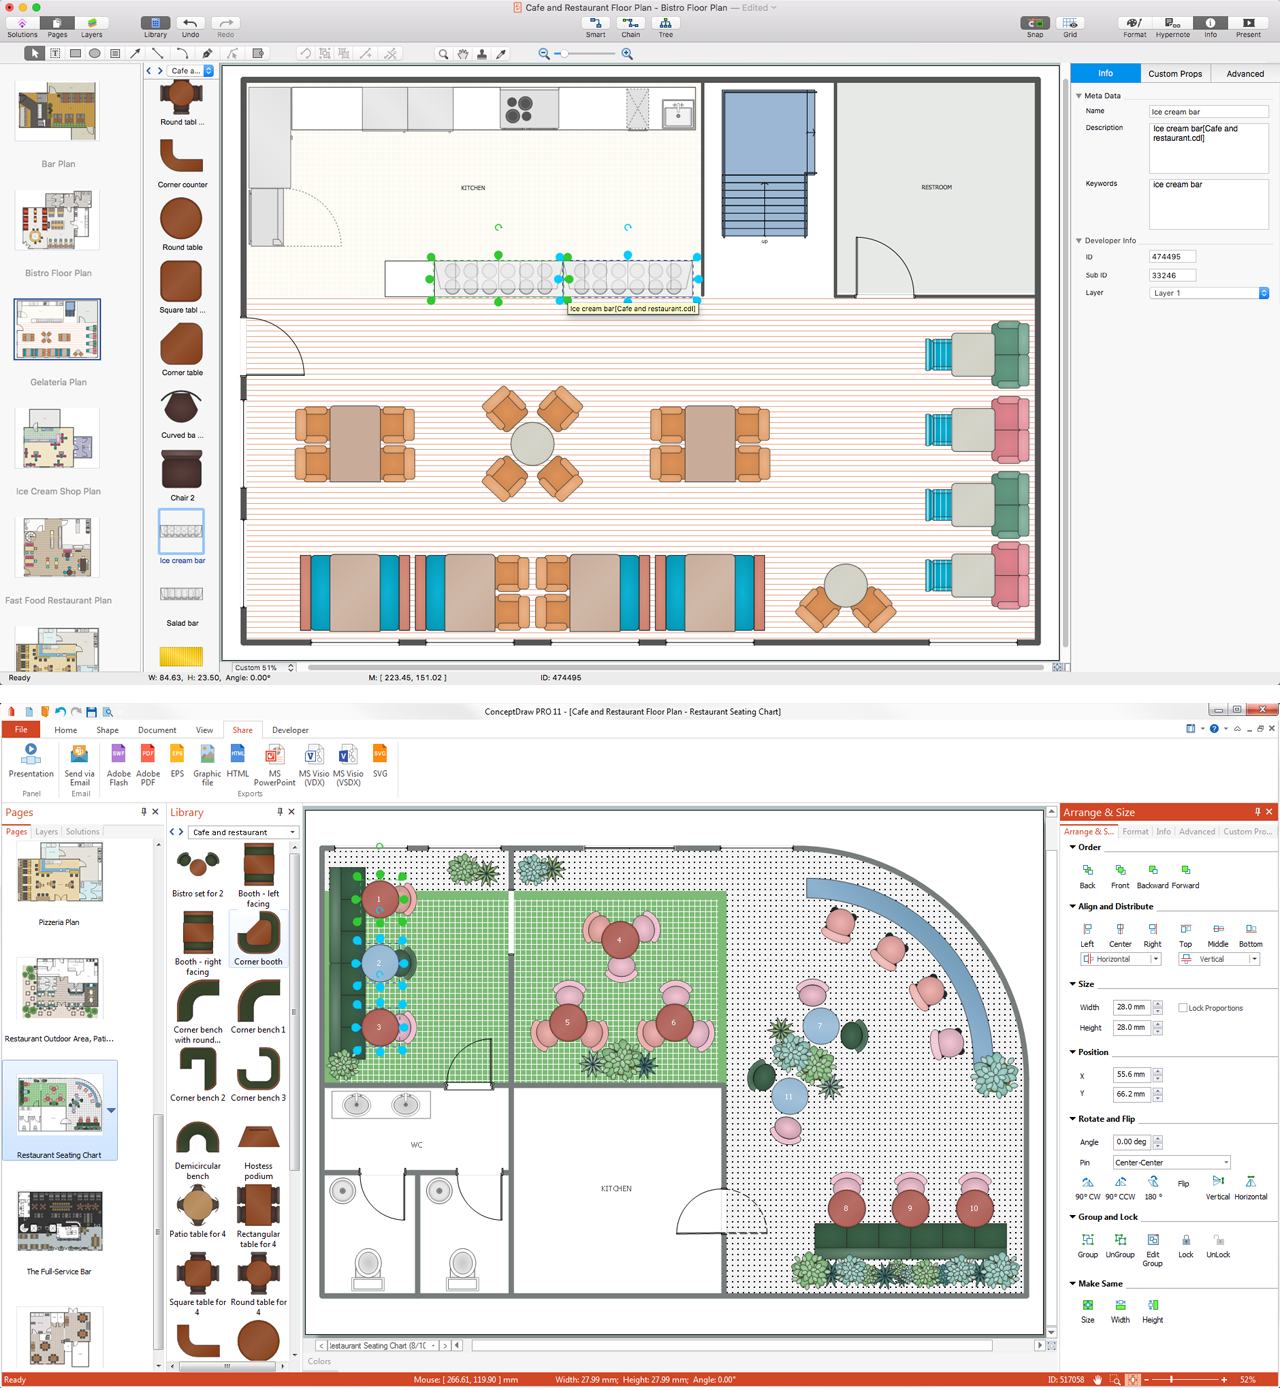
Picture: Interior Design Software. Building Plan Examples
Related Solution:
Network infrastructure planning is a very important process in the network construction, and the share of time allocated to this within the scope of the entire project may reach 60-80%. A competent and thorough approach to planning contributes to the quick investment return, and also increases the reliability and flexibility of the final system, reducing the probability of additional costs related to the incorrect implementation.
Any planning begins with an analysis of the business requirements to the final system. Basic network parameters, which should be assessed are the scalability, accessibility, cost, speed and safety.
Speed and cost are often mistaken for the most important parameters, and the rest of the parameters aren't even remembered. This is not entirely correct. Initially, it is necessary to assess the business plans for the future, because sometimes it is more profitable to invest more money in the beginning. If the business is to develop, then, consequently, demands on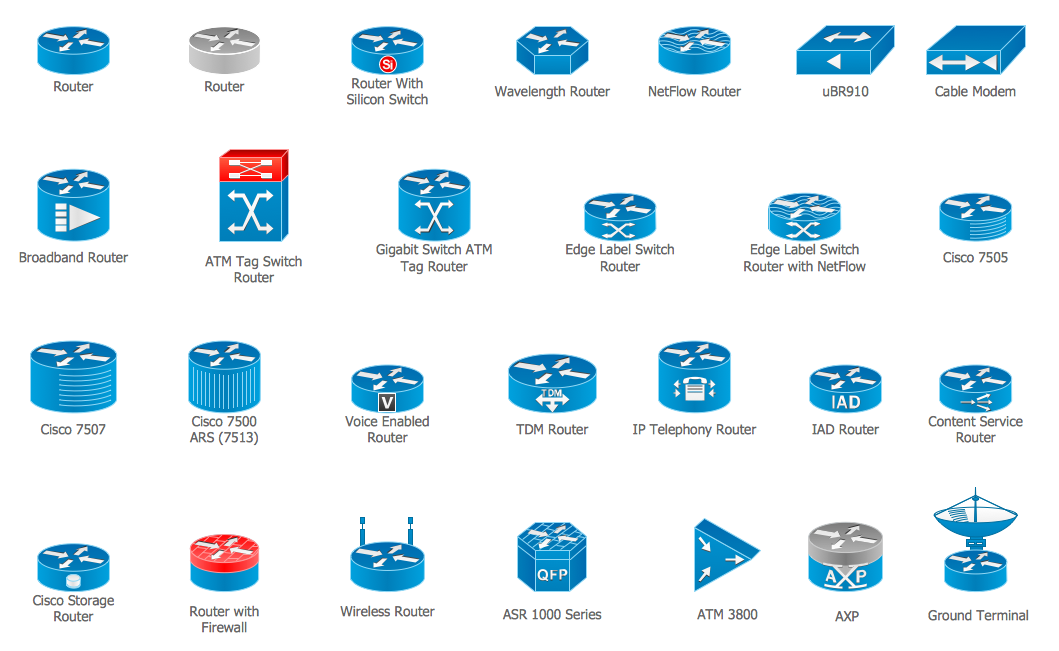
Picture: Cisco Routers. Cisco icons, shapes, stencils and symbols
Related Solution:
A family evening in a restaurant can be just charming, the problem is to find a one. If you spend an extra day to create a good restaurant floor plan, that will surely brings more clients. By the time your restaurant gets more popular, don’t forget about the quality of service.
The restaurant floor plan you see on this page was made with ConceptDraw DIAGRAM in accompanied with Cafe and Restaurant Plans solution. It introduces facilities of the solution and demonstrates the results, you can obtain if you deploy ConceptDraw tools for generating floor plans and interior designs for cafe, restaurants or other catering establishments. A little less than three hundred vector objects, and a set of built-in templates and a set of examples will maintain your creativeness.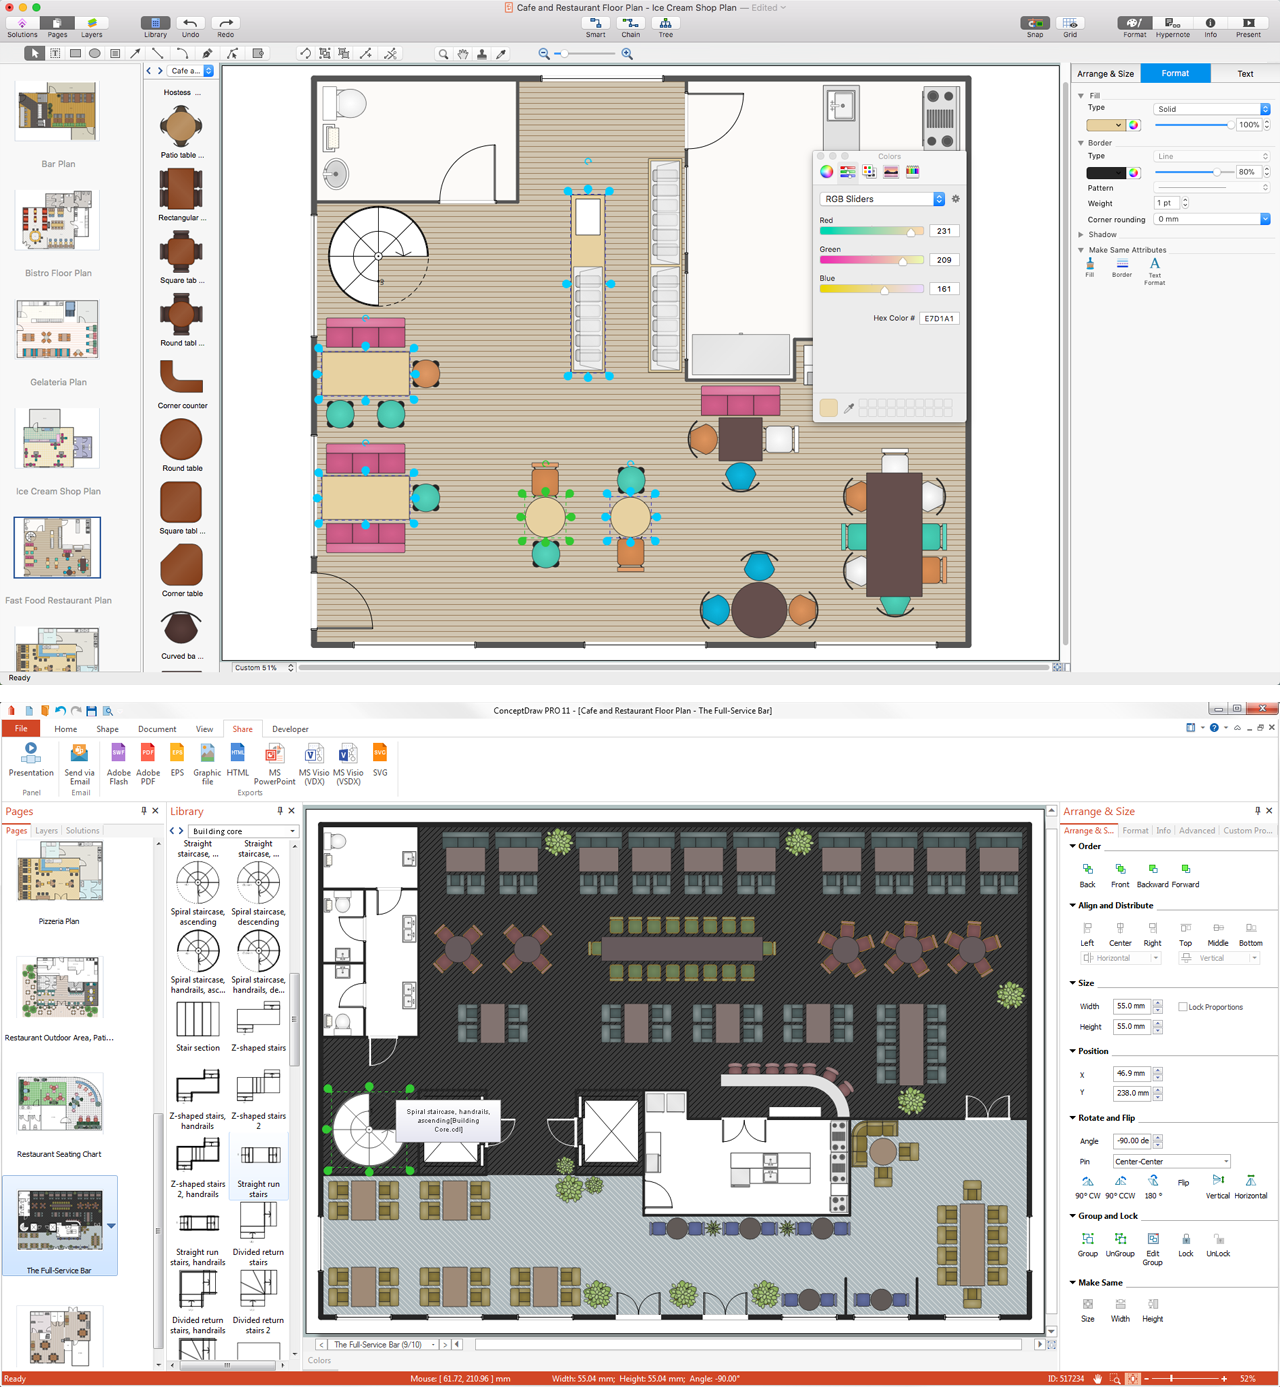
Picture: Restaurant Floor Plans
Related Solution:
Perfect Network Diagramming Software with examples of LAN Diagrams. ConceptDraw Network Diagram is ideal for network engineers and network designers who need to draw Logical Network diagrams.
Picture: Network Diagram SoftwareLogical Network Diagram
ConceptDraw DIAGRAM is a powerful diagramming and vector drawing software. Extended with Office Layout Plans Solution from the Building Plans Area, ConceptDraw DIAGRAM became the ideal software for making Office Floor Plans.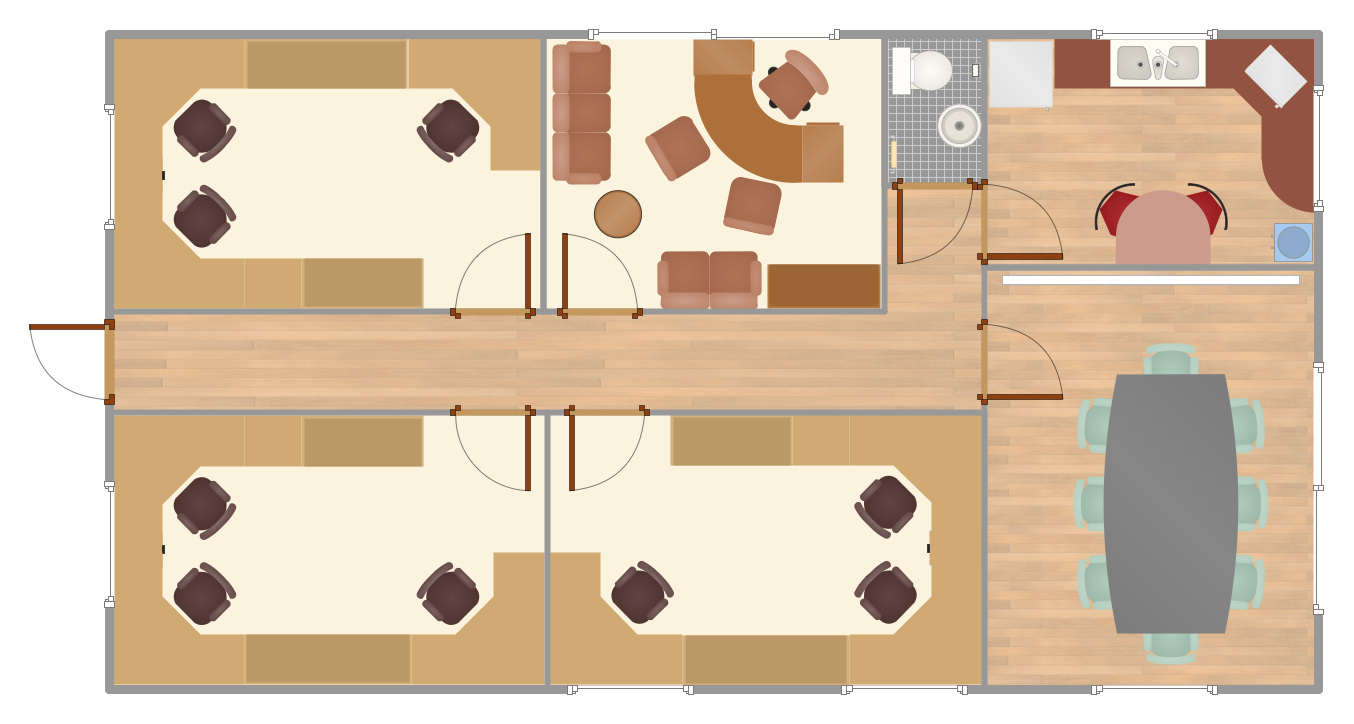
Picture: Office Floor Plans
Related Solution:
Infrastructure is very important part of any district, and educational buildings presence is one of the factors. Another not less important thing is the school design, because it influences the children's’ sense of aesthetics. To develop a harmonic school layout, use a proper software.
This image represents the School layout library that is supplied with ConceptDraw School and Training Plans solution. The library contains a set of vector graphic objects that will be in help while drawing a layout of classroom. Any lecturer desires to organize the layout of the classroom for the best student advantage. Students must be focused and be engaged in the learning process. The classroom places organization is an important element of a students learning. It is significant for a lecturer to set up a classroom layout and change it time to time to support lectures, to invoke disputes or solve any organizational issues. By using ConceptDraw DIAGRAM you can easily plan how to re-arrange the desks in the class room to maintain visual control of your class and build a friendly environment in the classroom.
Picture: Building Drawing Software for Design School Layout
Related Solution:
How To Make a Floor Plan? Usually drawing of Floor Plans is quite complex and time-taking process. But now thanks to the ConceptDraw DIAGRAM diagramming and vector drawing software extended with Floor Plans Solution from the Building Plans area of ConceptDraw Solution Park this process became quick and simple.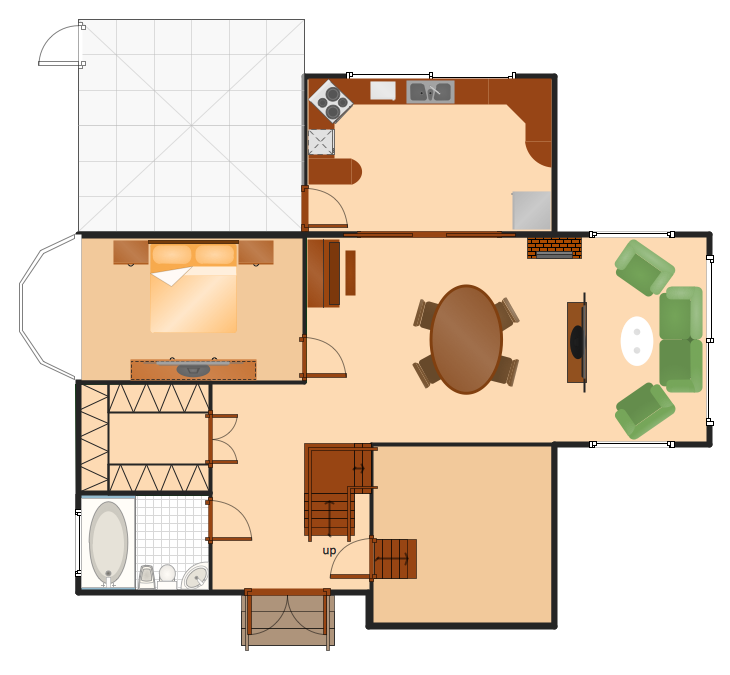
Picture: How To Make a Floor Plan
Related Solution:
ConceptDraw DIAGRAM extended with Floor Plans Solution from the Building Plans Area is a quick floor plan software for creating great-looking floor plans, floor charts and blueprints for facilities management, move management, office supply inventories, assets inventories, office space planning, and cubicles.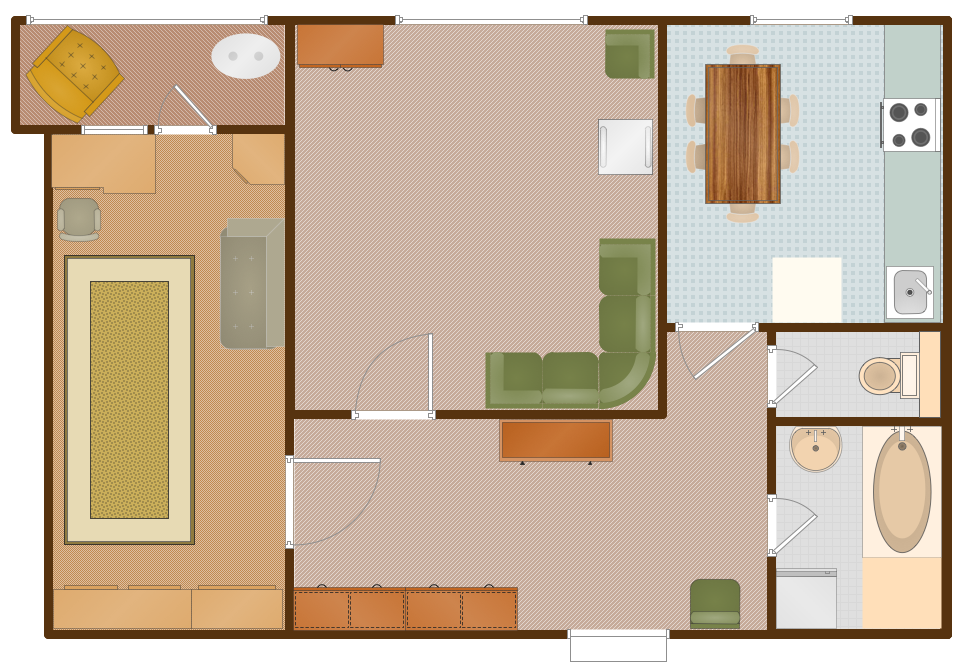
Picture: Floor Plan
Related Solution:

