Made with
ConceptDraw
DIAGRAM 18

Football – 2014 FIFA World Cup Standings Group

“The FIFA World Cup, often simply the World Cup, is an international association football competition contested by the senior men's national teams of the members of Fédération Internationale de Football Association (FIFA), the sport's global governing body. The current format of the tournament involves 32 teams competing for the title at venues within the host nation(s) over a period of about a month; this phase is often called the World Cup Finals. A qualification phase, which currently takes place over the preceding three years, is used to determine which teams qualify for the tournament together with the host nation(s).The 2014 FIFA World Cup will be the 20th FIFA World Cup, an international men's football tournament that is scheduled to take place in Brazil from 12 June to 13 July 2014. It will be the second time that Brazil has hosted the competition, the previous being in 1950.”[Wikipedia]

The 32 participating teams of 2014 FIFA World Cup were divided into the eight groups with four teams in each.

Whoever you are, sports fan, blogger, or journalist, you may be interested in tracking 2014 FIFA World Cup schedules and results. Now, visualizing the sports statistics becomes as easy as never before with ConceptDraw DIAGRAM diagramming and vector drawing software extended with the Soccer solution.

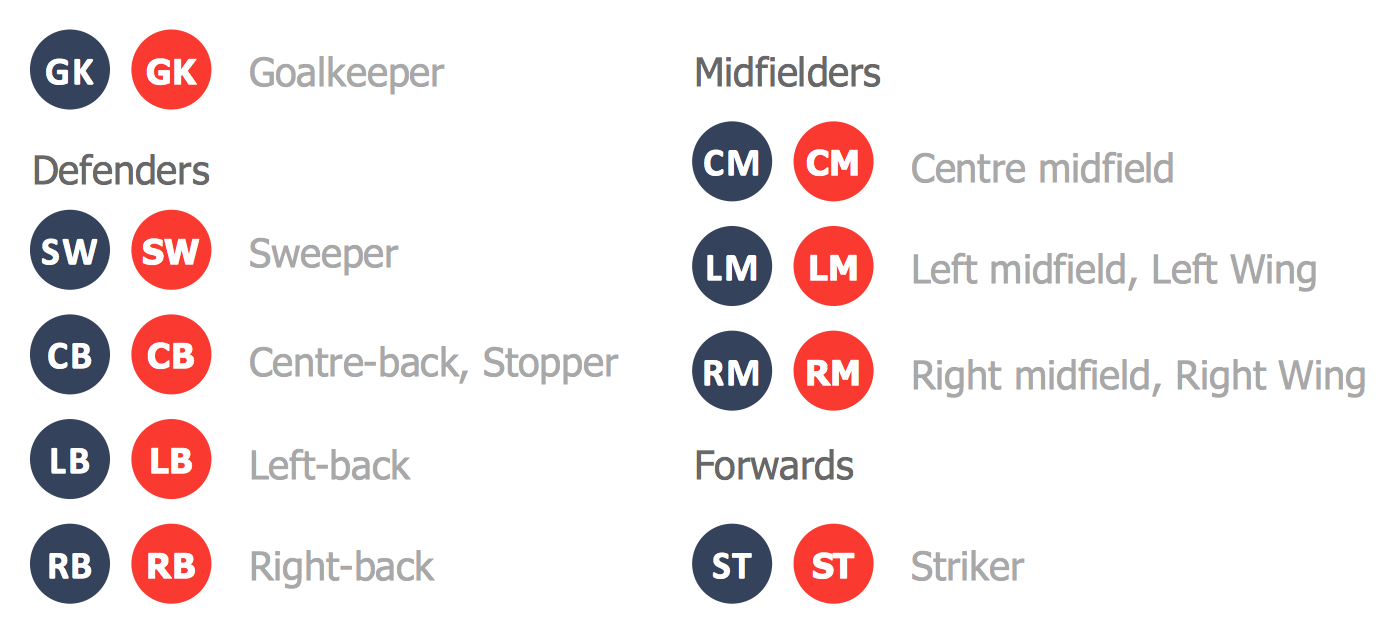
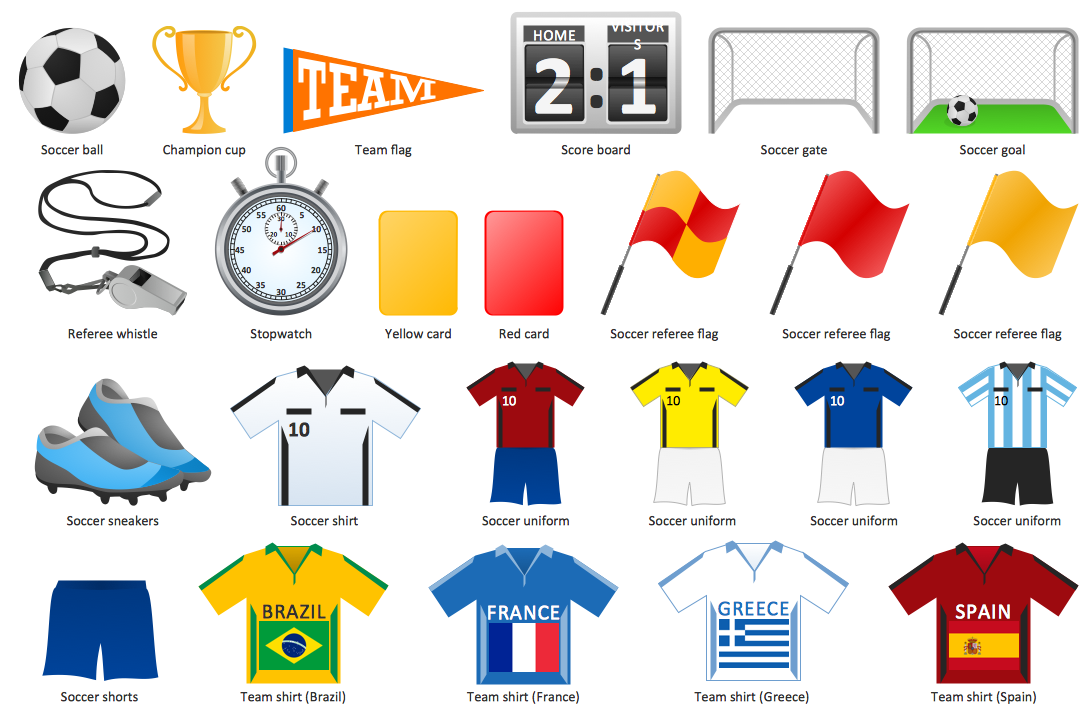
You can see below the samples representing the 2014 FIFA World Cup schedules and tournament tables for each of eight groups. These samples was created in ConceptDraw DIAGRAM using the “FIFA World Cup 2014 team flags”, “Soccer pictograms” and “Soccer silhouettes” libraries from the Soccer solution from the Sport area of ConceptDraw Solution Park.
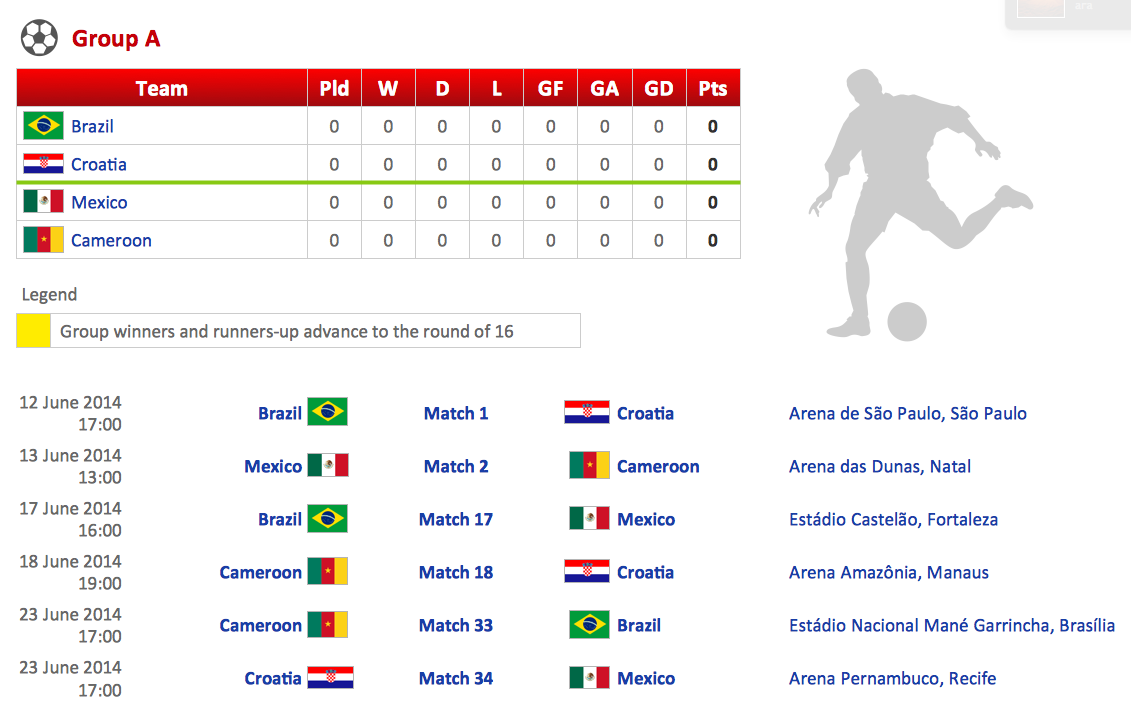
Football – 2014 FIFA World Cup Standings Group *

Sample 1. 2014 FIFA World Cup Standings Group A

Each sample displays the information about the pairs of teams of the group that will play, on which stadium will be the match and at what time. Also you can see the tournament tables that will display the information about the match results – about the number of matches, goals, winnings, etc.
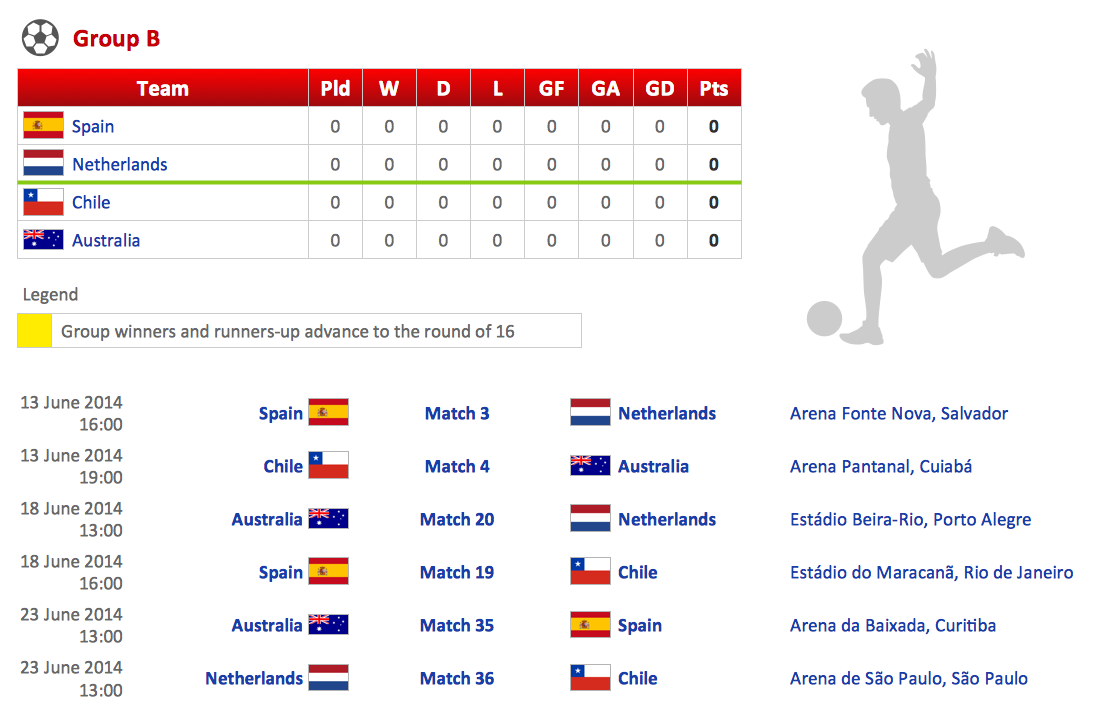
Football – 2014 FIFA World Cup Standings Group B

Sample 2. 2014 FIFA World Cup Standings Group B

All these samples were included to the Soccer solution. They are professional looking practical samples and you can quick and easy modify them, print, or publish on web.
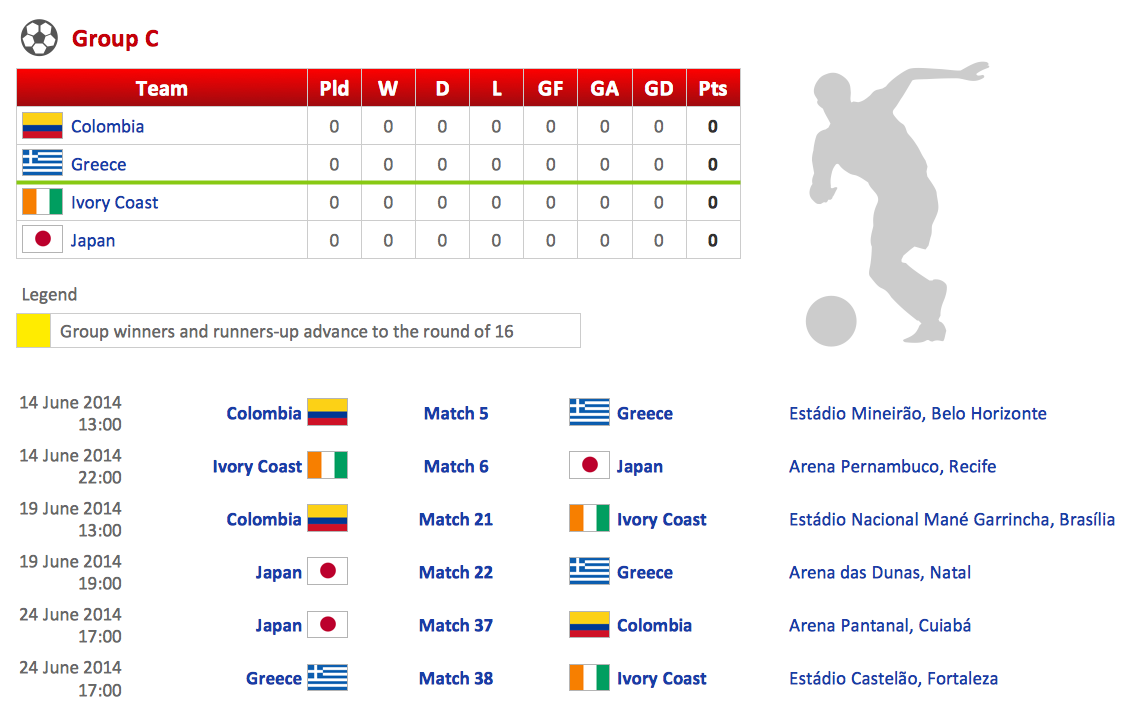
Football – 2014 FIFA World Cup Standings Group C

Sample 3. 2014 FIFA World Cup Standings Group C

“The ranking of each team in each group will be determined as follows:

  • Greater number of points in all group matches
  • Goal difference in all group matches
  • Greater number of goals scored in all group matches
  • Greatest number of points in matches between tied teams
  • Goal difference in matches between tied teams
  • Greatest number of goals scored in matches between tied teams
  • Drawing of lots by the FIFA Organising Committee”

    [Wikipedia]

Football – 2014 FIFA World Cup Standings Group D

Sample 4. 2014 FIFA World Cup Standings Group D

Two teams from each group will advance to knock out round, the round of sixteen. Top two teams with most points will qualify to the next round of 2014 FIFA World Cup.
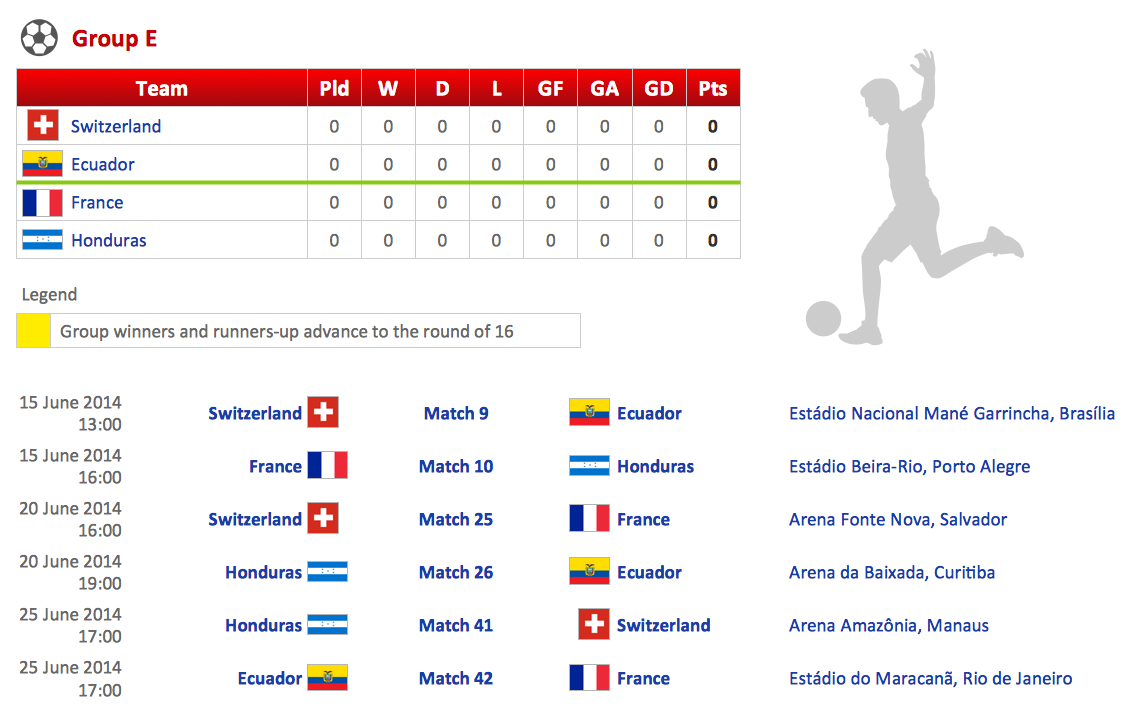
Football – 2014 FIFA World Cup Standings Group E

Sample 5. 2014 FIFA World Cup Standings Group E
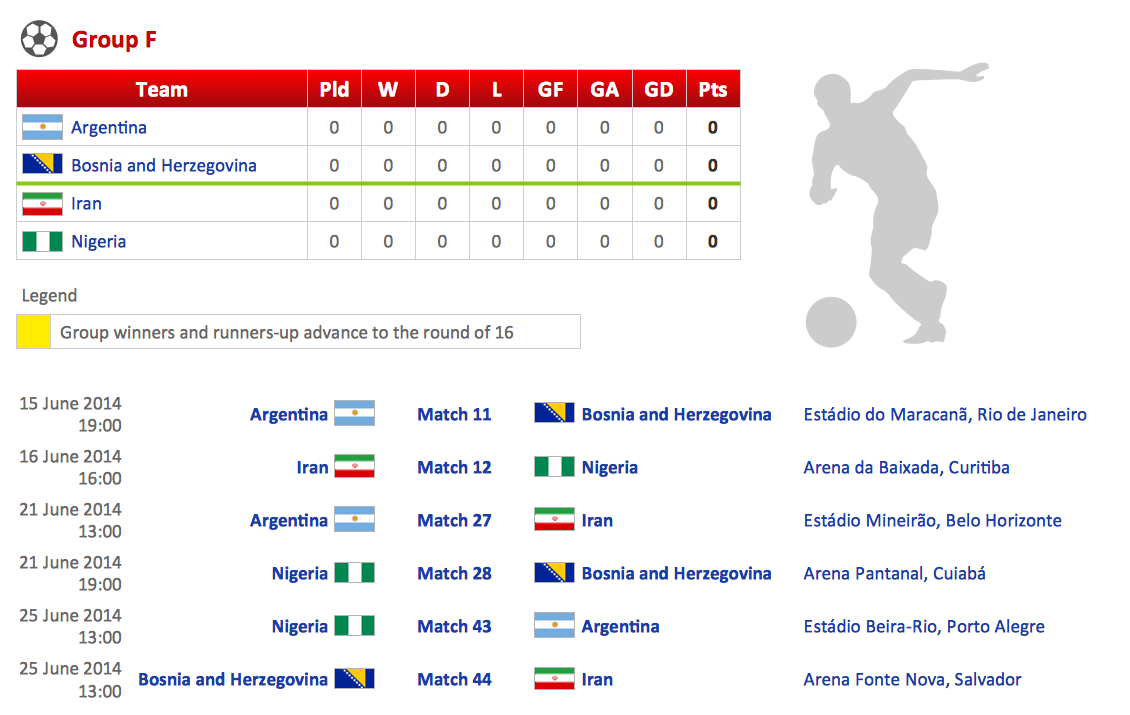
Football – 2014 FIFA World Cup Standings Group F

Sample 6. 2014 FIFA World Cup Standings Group F
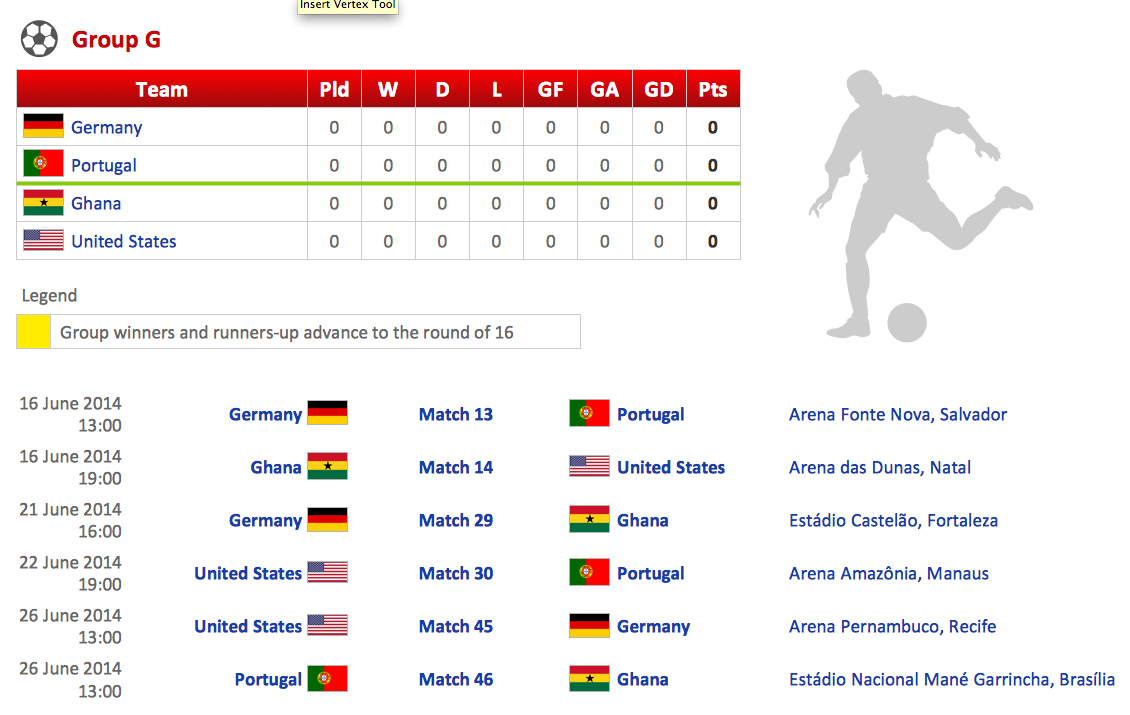
Football – 2014 FIFA World Cup Standings Group G

Sample 7. 2014 FIFA World Cup Standings Group G
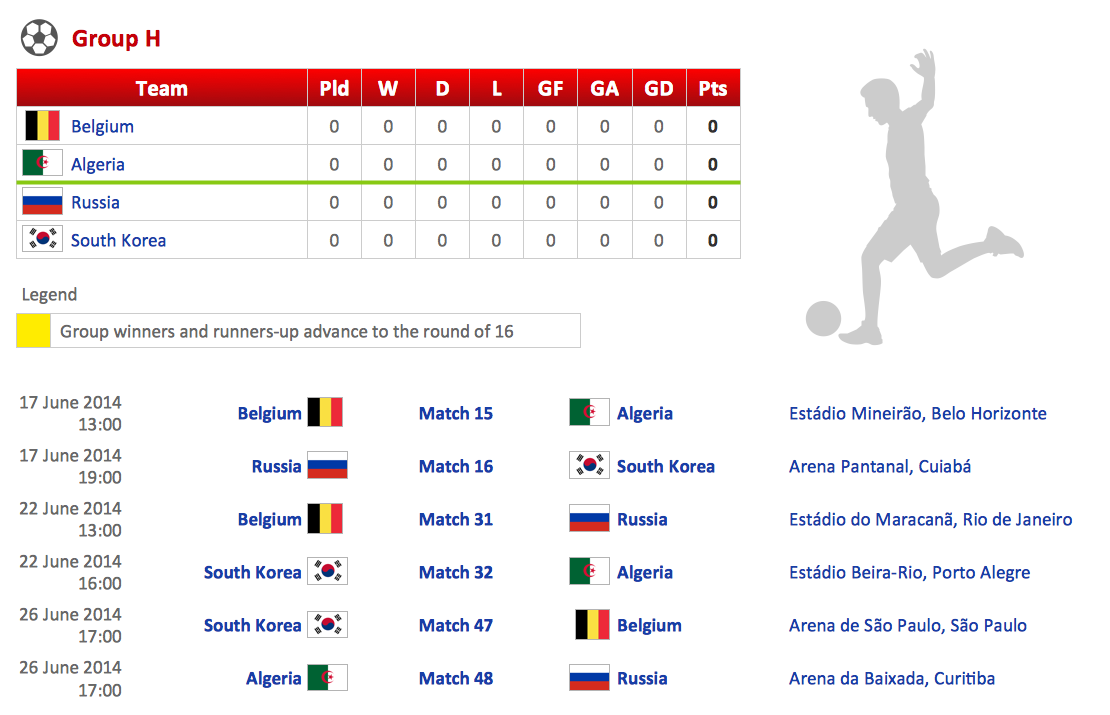
Football – 2014 FIFA World Cup Standings Group H

Sample 8. 2014 FIFA World Cup Standings Group H

The samples you see on this page were created in ConceptDraw DIAGRAM using the Soccer Solution. They demonstrate the solution's capabilities and the professional results you can achieve quick and easy. An experienced user spent 15 minutes creating every of these samples.

All source documents are vector graphic documents. They are available for reviewing, modifying, or converting to a variety of formats (PDF file, MS PowerPoint, MS Visio, and many other graphic formats) from the ConceptDraw STORE. The Soccer Solution is available for all ConceptDraw DIAGRAM or later users.



TEN RELATED HOW TO's:
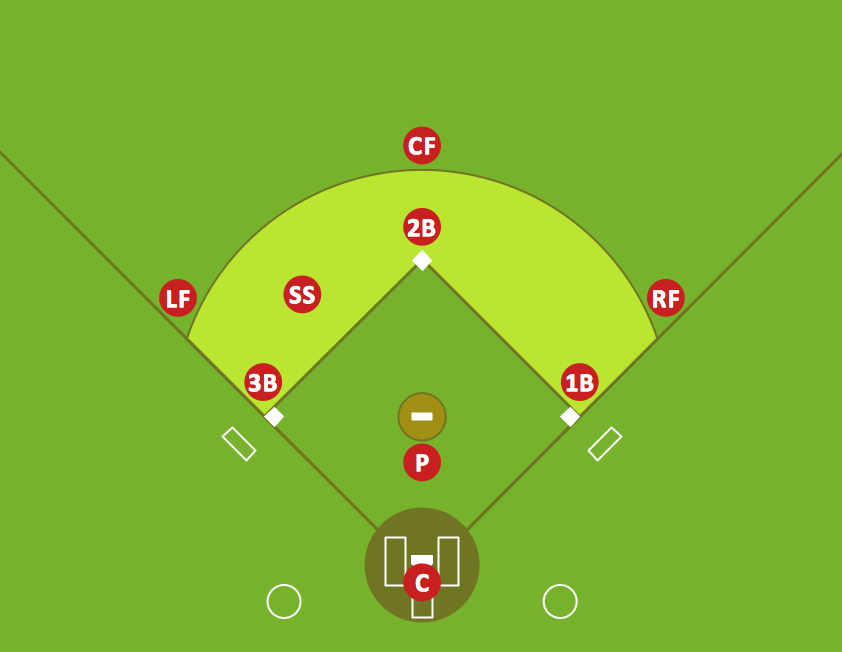
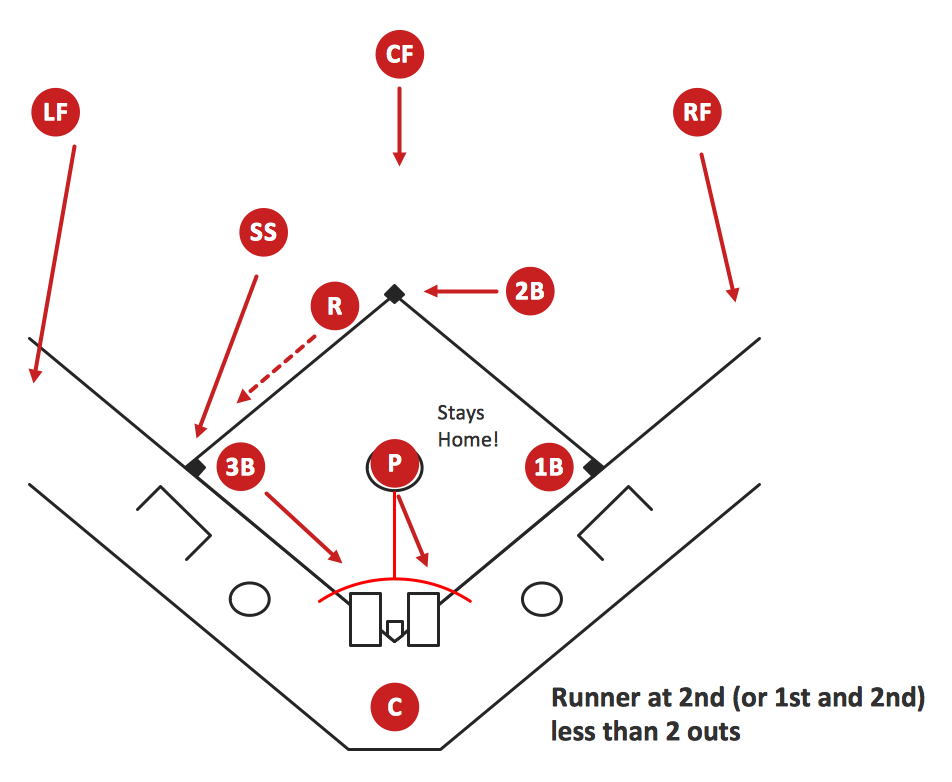
ConceptDraw DIAGRAM extended with the Baseball solution provides access to libraries, templates and samples allows creating baseball diagrams and schemas. All plays and positions diagrams are available as ready-to-modify samples.Baseball Field Sample
Picture: Baseball Field Sample
Related Solution:
You can see the samples representing the 2014 FIFA World Cup schedules and tournament tables for each of eight groups. These samples was created in ConceptDraw DIAGRAM using the “FIFA World Cup 2014 team flags”, “Soccer pictograms” and “Soccer silhouettes” libraries from the Soccer solution from the Sport area of ConceptDraw Solution Park.Football – 2014 FIFA World Cup Standings Group *
Picture: Football – 2014 FIFA World Cup Standings Group
Related Solution:
In general, you can use any icons to represent network equipment on a diagram. However, there are some icons, for instance, Cisco icons, shapes, stencils and symbols, that are recognizable worldwide. Using those icons you can create Cisco network topology diagrams in minutes and share them anywhere. The icons depicting Cisco network equipment are recognized and generally applied as standard images for designing network diagrams. They are free to used , but can not be reworked. Cisco network diagrams are created to depict how signals processed on the network equipment and end-user computers and how data transfer through LAN or WLAN between nodes. The vector graphic library of ConceptDraw CISCO Network Diagrams solution includes about 90 icons of Cisco network equipment for designing computer network diagrams with ConceptDraw DIAGRAM.Cisco Network Topology. <br>Cisco icons, shapes, stencils and symbols *
Picture: Cisco Network Topology. Cisco icons, shapes, stencils and symbols
Related Solution:
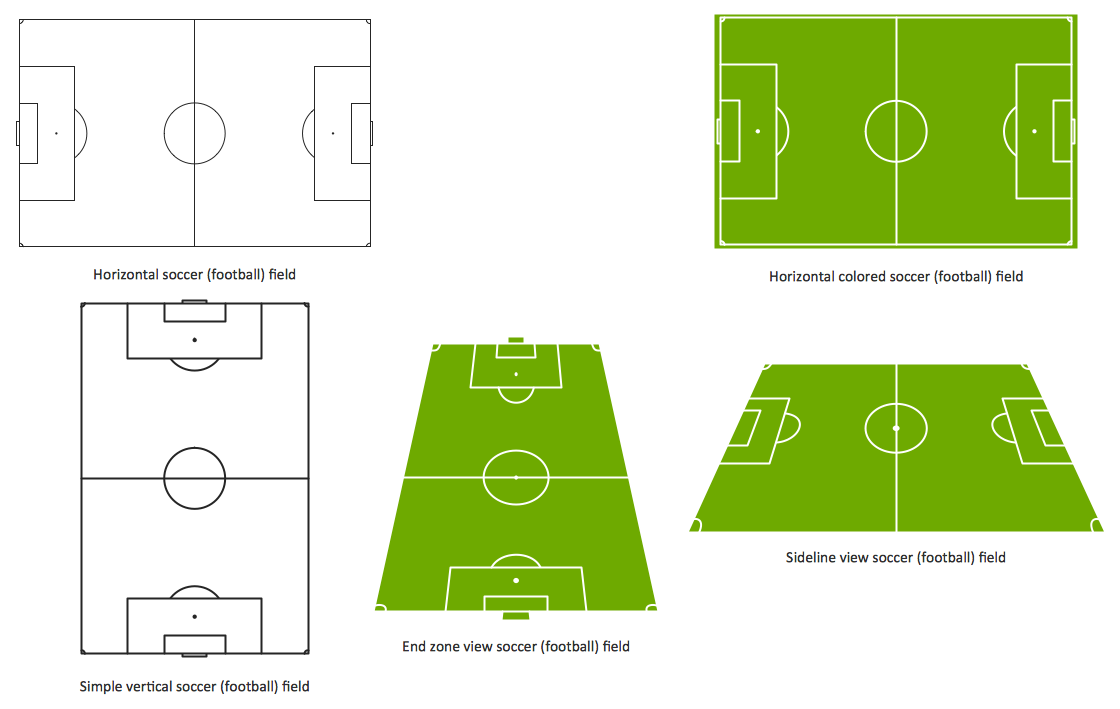
To quick and easy draw the diagrams with soccer (football) tactics, use the Soccer (Football) Fields and Soccer (Football) Positions libraries from the Soccer solution from the Sport area of ConceptDraw Solution ParkSoccer (Football) Tactics *
Picture: Soccer (Football) Tactics
Related Solution:
Electrical plan is a document that is developed during the first stage of the building design. This scheme is composed of conventional images or symbols of components that operate by means of electric energy. To simplify the creation of these schemes you can use house electrical plan software, which will not require a long additional training to understand how to use it. You only need to install the necessary software ant it’s libraries and you’ll have one less problem during the building projection. Any building contains a number of electrical systems, including switches, fixtures, outlets and other lightening equipment. All these should be depicted in a building electrical plans and included to general building documentation. This home electrical plan displays electrical and telecommunication devices placed to a home floor plan. On the plan, each electrical device is referenced with the proper symbol. Electrical symbols are used for universal recognition of the building plan by different persons who will be working on the construction. Not all possible electric symbols used on a certain plan, so the symbols used in the current home plan are included to a legend. The electrical home plan may be added as a separate document to a complete set of building plans.House Electrical Plan Software
Picture: How To use House Electrical Plan Software
Related Solution:
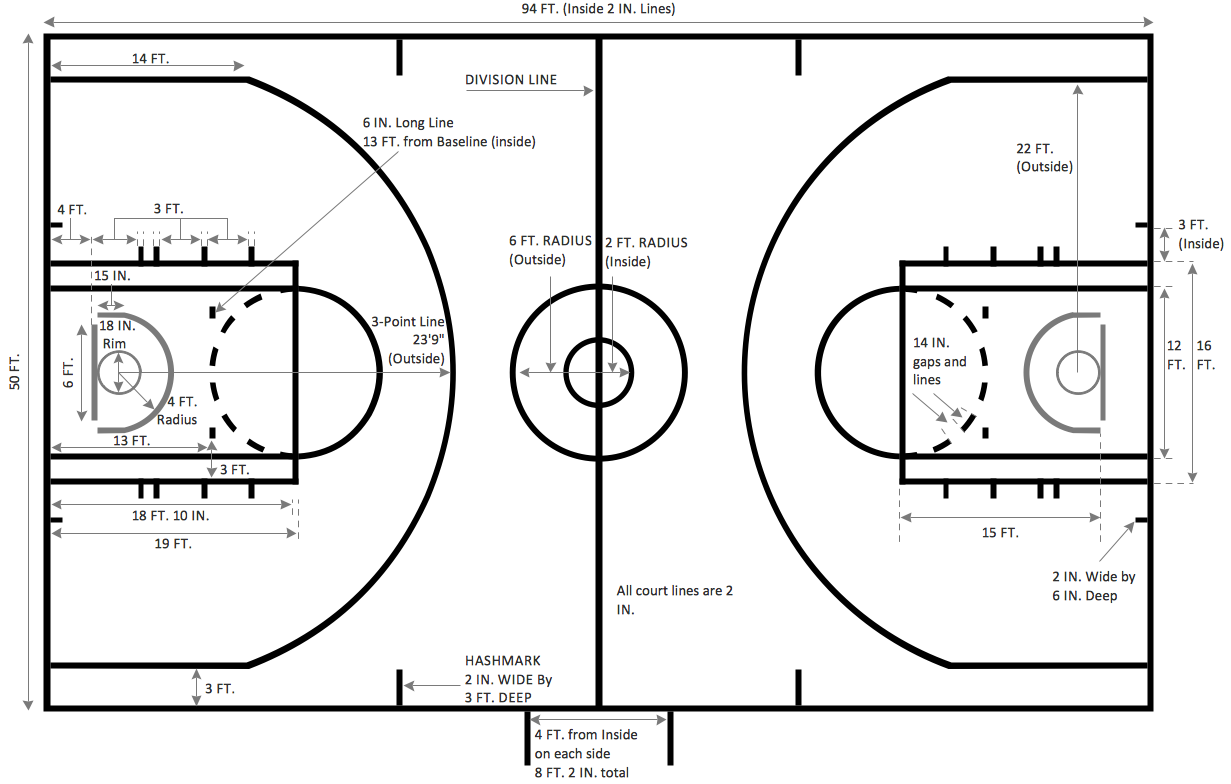
The Soccer solution from the Sport area of ConceptDraw Solution Park is designed as a tool that helps produce soccer illustrations of any complexity in minutes. You can quick and easy design the professional looking plan of the soccer field with set up dimensions.Soccer (Football) Dimensions *
Picture: Soccer (Football) Dimensions
Related Solution:
How to build segregation of duties using drawing tools from Accounting Flowcharts Solution for ConceptDraw DIAGRAM software.Approval Process and Segregation of Responsibilities<br>Accounting Flowchart Example *
Picture: Approval Process and Segregation of ResponsibilitiesAccounting Flowchart Example
Related Solution:
Create bar charts for event management problem solving and visual data comparison using the ConceptDraw DIAGRAM diagramming and vector drawing software extended with the Bar Graphs Solution from the Graphs and Charts area of ConceptDraw Solition Park.Bar Diagrams for Problem Solving.<br>Create event management bar charts with Bar Graphs Solution *
Picture: Bar Diagrams for Problem Solving.Create event management bar charts with Bar Graphs Solution
Related Solution:
Timeline is a type of diagram which illustrates the series of events in a chronological order on a linear timescale. How to make a timeline? It is convenient to use a modern powerful software. ConceptDraw DIAGRAM diagramming and vector drawing software extended with Timeline Diagrams solution from the Management area is exactly what you need.How to Make a Timeline *
Picture: How to Make a Timeline
Related Solution:
Thanks to Baseball solution all you need is just drag and drop ready-to-use positions objects to a template contains baseball field, and place positions on the field.Baseball Diagram — Defence Positions
Picture: Baseball Diagram — Defence Positions
Related Solution:
ConceptDraw
DIAGRAM 18