 Venn Diagrams
Venn Diagrams are actively used to illustrate simple set relationships in set theory and probability theory, logic and statistics, mathematics and computer science, linguistics, sociology, and marketing. Venn Diagrams are also often used to visually summarize the status and future viability of a project.
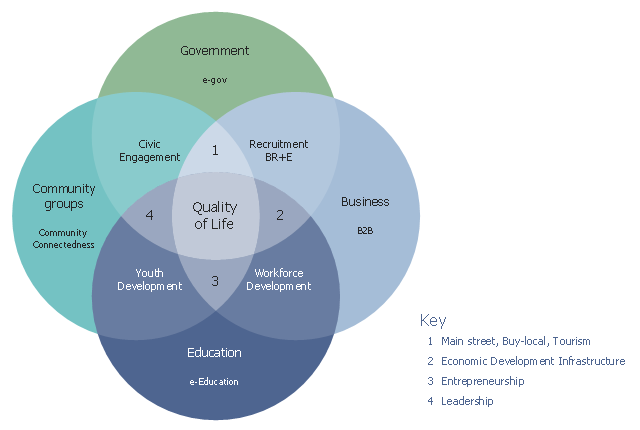
This Venn diagram sample shows how community elements overlap. It was designed on the base of the figure 1 in the course "eStrategies for Local Governments" from the website of the Southern Rural Development Center (SRDC), the Mississippi State University.
"Ultimately, the goal of this curriculum is to position a community for success as they develop web-based strategies for community and economic development. In support of this goal, the authors use a conceptual model that incorporates four fundamental elements (applications) of a community: government, business, education and community groups (Figure 1). Using the Venn diagram, it shows that each of these elements overlap with another, finally culminating in “Quality of Life” where all four overlap." [srdc.msstate.edu/ ecommerce/ curricula/ egovernment/ overview.html]
The Venn diagram example "Community elements overlapping" was created using the ConceptDraw PRO diagramming and vector drawing software extended with the Venn Diagrams solution from the area "What is a Diagram" of ConceptDraw Solution Park.
Venn diagram
This Venn diagram sample depicts the path to sustainable development.
"Sustainable development is an organizing principle for human life on a finite planet. It posits a desirable future state for human societies in which living conditions and resource-use meet human needs without undermining the sustainability of natural systems and the environment, so that future generations may also have their needs met.
Sustainable development ties together concern for the carrying capacity of natural systems with the social and economic challenges faced by humanity. As early as the 1970s, 'sustainability' was employed to describe an economy "in equilibrium with basic ecological support systems." Scientists in many fields have highlighted The Limits to Growth, and economists have presented alternatives, for example a 'steady state economy', to address concerns over the impacts of expanding human development on the planet." [Sustainable development. Wikipedia]
The Venn diagram example "Path to sustainable development" was created using the ConceptDraw PRO diagramming and vector drawing software extended with the Venn Diagrams solution from the area "What is a Diagram" of ConceptDraw Solution Park.
Venn diagram

 Target and Circular Diagrams
This solution extends ConceptDraw PRO software with samples, templates and library of design elements for drawing the Target and Circular Diagrams.
 Pyramid Diagrams
Pyramid Diagrams solution extends ConceptDraw PRO software with templates, samples and library of vector stencils for drawing the marketing pyramid diagrams.
 Bar Graphs
The Bar Graphs solution enhances ConceptDraw PRO v10 functionality with templates, numerous professional-looking samples, and a library of vector stencils for drawing different types of Bar Graphs, such as Simple Bar Graph, Double Bar Graph, Divided Bar Graph, Horizontal Bar Graph, Vertical Bar Graph, and Column Bar Chart.
 UK Map
The Map of UK solution contains collection of professionally designed samples and scalable vector stencil graphics maps, representing the United Kingdom counties, regions and cities. Use the Map of UK solution from ConceptDraw Solution Park as the base fo
 Stakeholder Onion Diagrams
The Stakeholder Onion Diagram is often used as a way to view the relationships of stakeholders to a project goal. A basic Onion Diagram contains a rich information. It shows significance of stakeholders that will have has influence to the success achieve
 Bubble Diagrams
Bubble diagrams have enjoyed great success in software engineering, architecture, economics, medicine, landscape design, scientific and educational process, for ideas organization during brainstorming, for making business illustrations, presentations, planning, design, and strategy development. They are popular because of their simplicity and their powerful visual communication attributes.
 Website Wireframe
The innovative Website Wireframe solution enhances the ConceptDraw PRO v10 functionality with newest wireframe tools, libraries with variety of predesigned icons, symbols, buttons, graphics, forms, boxes, and many other vector elements, templates and professionally designed samples, which make it the best wireframing software. Website Wireframe solution gives you significant advantages when designing and maintaining websites, creating skeletal and content-free depictions of website structure, making website prototypes and planning the content arrangement before committing to design, also speeds up the processes of sketching, producing and sharing wireframe examples of website style and interface design.
- Venn Diagram In Community Development
- Community elements overlapping | Germany Map | Venn Diagram ...
- Venn Diagram Problem Chart In Community Development
- Venn Diagrams | Urban Community Development Clipart
- Path to sustainable development | Venn Diagram Examples for ...
- Venn Diagram Examples for Problem Solving. Environmental Social ...
- Sustainable Development Flow Chart
- Relation In Venn Diagram Sustainable Development
- Diagram Of Development
- Diagrams Of Community Development
- Basic Circles Venn Diagram . Venn Diagram Example | Venn ...
- Fundraising pyramid diagram for community based cash donors
- UML Deployment Diagram. Design Elements | Venn Diagram ...
- Pyramid Chart Examples | Principles Of Growth And Development
- Green Development Diagram
- Development Diagram
- Differences And Similarities Of An Ideal Community And Existing ...
- Venn diagram - Path to sustainable development | Sustainable ...
- Venn Diagrams | Venn Diagram Examples for Problem Solving ...
- Venn Diagram Examples for Problem Solving. Venn Diagram as a ...
- ERD | Entity Relationship Diagrams, ERD Software for Mac and Win
- Flowchart | Basic Flowchart Symbols and Meaning
- Flowchart | Flowchart Design - Symbols, Shapes, Stencils and Icons
- Flowchart | Flow Chart Symbols
- Electrical | Electrical Drawing - Wiring and Circuits Schematics
- Flowchart | Common Flowchart Symbols
- Flowchart | Common Flowchart Symbols