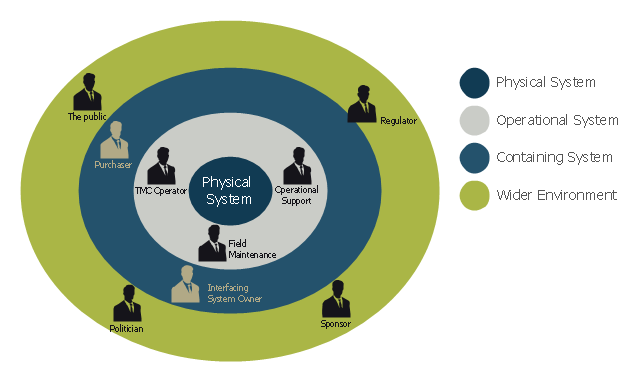
This onion diagram example was designed on the base of figure "Stakeholders for a System" in the slide presentation "A103: Introduction to ITS Standards Requirements Development" from the U.S. Department of Transportation (US DOT) website.
"“Stakeholders for a System.” A graphic of four concentric circles arranged like an archery target. The innermost circle is a reddish tan. The three bands of colors that are further from the center are in lighter shades of tan. This is called an “onion diagram” as onions are made up of multiple layers. The inner circle is labeled “Physical System.” The next layer outward is labeled “Operational System.” The next layer outward is labeled “Containing System.” The outermost layer is labeled “Wider Environment.” There are smaller black graphics of person positioned in the different layers of the diagram. Each person has a project role next to it as follows: 1) Inner Circle has no people – It represents the system; 2) Next Layer Outward has three people labeled TMC Operator, Field Maintenance, and Operational Support respectively; 3) Next Layer Outward has two people labeled Interfacing System Owner and Purchaser respectively; and 4) Outermost Layer has four people labeled Sponsor of the Project, Regulatory Agency, Public, and Politician respectively. The picture demonstrates while they are all stakeholders, different stakeholders have different levels of influence on the physical system to be defined. The most influence coming from those closest to the center."
[pcb.its.dot.gov/ standardstraining/ mod04/ ppt/ m04ppt.htm]
The onion diagram example "System stakeholders diagram" was drawn using the ConceptDraw PRO software extended with the Stakeholder Onion Diagrams solution from the Management area of ConceptDraw Solution Park.
Onion diagram example
HelpDesk
How to Create a Business Process Diagram

HelpDesk
How to Create a Custom Filter in ConceptDraw PROJECT for Windows

ConceptDraw Arrows10 Technology

"Tree"- mode drawing works like that. Just select objects in your drawing and press Tree or Chain button to connect all of them just in one click.
Your diagram looks professional and it took only a moment to draw.
HelpDesk
How to Convert a Mind Map into MS Word Document

- Visual Basic For Next Flow Chart Examples
- Basic Flowchart Symbols and Meaning | Flowchart Continued Next ...
- ConceptDraw Solution Park | Main Idea Next Level
- Basic Flowchart Symbols and Meaning | Square Box White Inside ...
- How To Continue Flow Chart In Next Page
- How To Continue Flow Chart To Next Page
- Flowchart Symbol For Next Page
- ConceptDraw Upgrade
- How To Continue Flow Chat On Next Page
- Stakeholder Management System | System stakeholders diagram ...
- What Is The Symbol Of Next Page In Flowchart
- ConceptDraw PRO Network Diagram Tool | Daisy Chain Network ...
- Daisy Chain Network Topology | Block Diagram | Plc Symbols Pdf
- Campus Area Networks (CAN). Computer and Network Examples ...
- Daisy Chain Network Topology | How To Draw Cctv Cable Layout Plan
- Audio Visual Connectors Types | CCTV Network Example | Network ...
- Daisy Chain Network Topology | Cisco Network Design. Cisco icons ...
- CCTV Network Example | CCTV Network Diagram Software | Daisy ...
- Daisy Chain Network Topology | Network Diagram Software LAN ...
- Daisy Chain Network Topology | Fully Connected Network Topology ...
- ERD | Entity Relationship Diagrams, ERD Software for Mac and Win
- Flowchart | Basic Flowchart Symbols and Meaning
- Flowchart | Flowchart Design - Symbols, Shapes, Stencils and Icons
- Flowchart | Flow Chart Symbols
- Electrical | Electrical Drawing - Wiring and Circuits Schematics
- Flowchart | Common Flowchart Symbols
- Flowchart | Common Flowchart Symbols